Maryland's 4th congressional district
| Maryland's 4th congressional district | |
|---|---|
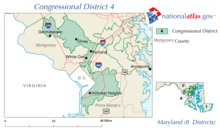
.tif.png) Maryland's 4th congressional district - since January 3, 2013. | |
| Current Representative | Anthony G. Brown (D–Largo) |
| Area | 318 sq mi (820 km2) |
| Distribution |
|
| Population (2000) | 662,062 |
| Median income | 57,727 |
| Ethnicity |
|
| Occupation |
|
| Cook PVI | D+28[1] |
Maryland's 4th congressional district comprises portions of Prince George's County and Anne Arundel County. The seat is represented by Anthony G. Brown, a Democrat.
The district is located in the suburbs of Washington, D.C.
Voting
| Election results from presidential races | ||
|---|---|---|
| Year | Office | Results |
| 2016 | President | Clinton 77.7% - 19.2% |
| 2012 | President | Obama 78.3% - 20.7% |
| 2008 | President | Obama 85% - 14% |
| 2004 | President | Kerry 78% - 21% |
| 2000 | President | Gore 77% - 21% |
Recent elections
| Party | Candidate | Votes | % | |
|---|---|---|---|---|
| Democratic | Paul Sarbanes | 54,936 | 70.05 | |
| Republican | David Fentress | 23,491 | 29.95 | |
| Total votes | 78,427 | 100.00 | ||
| Democratic hold | ||||
| Party | Candidate | Votes | % | |||
|---|---|---|---|---|---|---|
| Republican | Marjorie Holt | 87,534 | 59.38 | |||
| Democratic | Werner Fornos | 59,877 | 40.62 | |||
| Total votes | 147,411 | 100.00 | ||||
| Republican gain from Democratic | ||||||
| Party | Candidate | Votes | % | |
|---|---|---|---|---|
| Republican | Marjorie Holt (inc.) | 61,208 | 58.15 | |
| Democratic | Fred L. Wineland | 44,059 | 41.85 | |
| Total votes | 105,267 | 100.00 | ||
| Republican hold | ||||
| Party | Candidate | Votes | % | |
|---|---|---|---|---|
| Republican | Marjorie Holt (inc.) | 95,158 | 57.67 | |
| Democratic | Werner Fornos | 69,855 | 42.33 | |
| Total votes | 165,013 | 100.00 | ||
| Republican hold | ||||
| Party | Candidate | Votes | % | |
|---|---|---|---|---|
| Republican | Marjorie Holt (inc.) | 71,374 | 62.04 | |
| Democratic | Sue F. Ward | 43,663 | 37.96 | |
| Total votes | 115,037 | 100.00 | ||
| Republican hold | ||||
| Party | Candidate | Votes | % | |
|---|---|---|---|---|
| Republican | Marjorie Holt (inc.) | 120,985 | 71.86 | |
| Democratic | James J. Riley | 47,375 | 28.14 | |
| Total votes | 168,360 | 100.00 | ||
| Republican hold | ||||
| Party | Candidate | Votes | % | |
|---|---|---|---|---|
| Republican | Marjorie Holt (inc.) | 75,617 | 61.20 | |
| Democratic | Patricia O'Brien Aiken | 47,947 | 38.80 | |
| Total votes | 123,564 | 100.00 | ||
| Republican hold | ||||
| Party | Candidate | Votes | % | |
|---|---|---|---|---|
| Republican | Marjorie Holt (inc.) | 114,430 | 66.24 | |
| Democratic | Howard M. Greenbaum | 58,312 | 33.76 | |
| Write-ins | 1 | <0.01 | ||
| Total votes | 172,743 | 100.00 | ||
| Republican hold | ||||
| Party | Candidate | Votes | % | |||
|---|---|---|---|---|---|---|
| Democratic | C. Thomas McMillen | 65,071 | 50.16 | |||
| Republican | Robert R. Neall | 64,643 | 49.84 | |||
| Total votes | 129,714 | 100.00 | ||||
| Democratic gain from Republican | ||||||
| Party | Candidate | Votes | % | |
|---|---|---|---|---|
| Democratic | C. Thomas McMillen (inc.) | 128,624 | 68.30 | |
| Republican | Bradlyn McClanahan | 59,688 | 31.70 | |
| Total votes | 188,312 | 100.00 | ||
| Democratic hold | ||||
| Party | Candidate | Votes | % | |
|---|---|---|---|---|
| Democratic | C. Thomas McMillen (inc.) | 85,601 | 58.85 | |
| Republican | Bob Duckworth | 59,846 | 41.15 | |
| Total votes | 145,447 | 100.00 | ||
| Democratic hold | ||||
| Party | Candidate | Votes | % | |
|---|---|---|---|---|
| Democratic | Al Wynn | 136,902 | 75.19 | |
| Republican | Michele Dyson | 45,166 | 24.81 | |
| Total votes | 182,068 | 100.00 | ||
| Democratic hold | ||||
| Party | Candidate | Votes | % | |
|---|---|---|---|---|
| Democratic | Al Wynn (inc.) | 93,148 | 75.03 | |
| Republican | Michele Dyson | 30,999 | 24.97 | |
| Total votes | 124,147 | 100.00 | ||
| Democratic hold | ||||
| Party | Candidate | Votes | % | |
|---|---|---|---|---|
| Democratic | Al Wynn (inc.) | 142,094 | 85.19 | |
| Republican | John B. Kimble | 24,700 | 14.81 | |
| Total votes | 166,794 | 100.00 | ||
| Democratic hold | ||||
| Party | Candidate | Votes | % | |
|---|---|---|---|---|
| Democratic | Al Wynn (inc.) | 129,139 | 85.72 | |
| Republican | John B. Kimble | 21,518 | 14.28 | |
| Total votes | 150,657 | 100.00 | ||
| Democratic hold | ||||
| Party | Candidate | Votes | % | |
|---|---|---|---|---|
| Democratic | Al Wynn (inc.) | 172,624 | 87.20 | |
| Republican | John B. Kimble | 24,973 | 12.61 | |
| Write-ins | 372 | 0.19 | ||
| Total votes | 197,969 | 100.00 | ||
| Democratic hold | ||||
| Party | Candidate | Votes | % | |
|---|---|---|---|---|
| Democratic | Al Wynn (inc.) | 131,644 | 78.96 | |
| Republican | John B. Kimble | 34,890 | 20.93 | |
| Write-ins | 195 | 0.12 | ||
| Total votes | 166,729 | 100.00 | ||
| Democratic hold | ||||
| Party | Candidate | Votes | % | |
|---|---|---|---|---|
| Democratic | Al Wynn (inc.) | 196,809 | 75.23 | |
| Republican | John McKinnis | 52,907 | 20.22 | |
| Green | Theresa Mitchell Dudley | 11,885 | 4.54 | |
| Write-ins | 6 | <0.01 | ||
| Total votes | 261,607 | 100.00 | ||
| Democratic hold | ||||
| Party | Candidate | Votes | % | |
|---|---|---|---|---|
| Democratic | Al Wynn (inc.) | 141,897 | 80.67 | |
| Republican | Michael Moshe Starkman | 32,792 | 18.64 | |
| Write-ins | 1,214 | 0.69 | ||
| Total votes | 175,903 | 100.00 | ||
| Democratic hold | ||||
| Party | Candidate | Votes | % | |
|---|---|---|---|---|
| Democratic | Donna Edwards | 16,481 | 80.54 | |
| Republican | Peter James | 3,638 | 17.78 | |
| Libertarian | Thibeaux Lincecum | 216 | 1.06 | |
| Write-ins | 127 | 0.62 | ||
| Total votes | 20,462 | 100.00 | ||
| Democratic hold | ||||
| Party | Candidate | Votes | % | |
|---|---|---|---|---|
| Democratic | Donna Edwards (inc.) | 258,704 | 85.83 | |
| Republican | Peter James | 38,739 | 12.85 | |
| Libertarian | Thibeaux Lincecum | 3,384 | 1.12 | |
| Write-ins | 604 | 0.20 | ||
| Total votes | 301,431 | 100.00 | ||
| Democratic hold | ||||
| Party | Candidate | Votes | % | |
|---|---|---|---|---|
| Democratic | Donna Edwards (inc.) | 160,228 | 83.44 | |
| Republican | Robert Broadus | 31,467 | 16.39 | |
| Write-ins | 325 | 0.17 | ||
| Total votes | 192,020 | 100.00 | ||
| Democratic hold | ||||
| Party | Candidate | Votes | % | |
|---|---|---|---|---|
| Democratic | Donna Edwards (inc.) | 240,385 | 77.17 | |
| Republican | Faith M. Loudon | 64,560 | 20.72 | |
| Libertarian | Scott Soffen | 6,204 | 1.99 | |
| N/A | Write-ins | 363 | 0.12 | |
| Total votes | 311,512 | 100 | ||
| Democratic hold | ||||
| Party | Candidate | Votes | % | |
|---|---|---|---|---|
| Democratic | Donna Edwards (inc.) | 134,628 | 70.18 | |
| Republican | Nancy Hoyt | 54,217 | 28.26 | |
| Libertarian | Arvin Vohra | 2,795 | 1.46 | |
| N/A | Write-ins | 197 | 0.10 | |
| Total votes | 191,837 | 100 | ||
| Democratic hold | ||||
Early historical boundaries and population
Maryland's Fourth Congressional District was one of the about 50 original Congressional districts. The First Congress of the United States of America. When it was organized in 1788 it covered Baltimore, Baltimore County, and Harford County. According to the 1790 Census, the Fourth District had a population of 53,913, nearly 20% of whom were slaves.[25]
In 1792, the Fourth District was moved to western Maryland, with its eastern boundary being a north to south line running about the midpoint of Frederick County, Maryland. The new district had a population of 36,026, with less than 10% of the population being slaves.[26] The 1800 Census population was 38,015, and the boundaries remained unchanged in 1802.[27]
List of representatives
1789–1835: One seat
| Name | Took office | Left office | Party | Notes/Events | |
|---|---|---|---|---|---|
| 1 | _(cropped).jpg) | March 4, 1789 | March 3, 1791 | Anti-Administration | |
| 2 |  | March 4, 1791 | March 3, 1793 | Anti-Administration | |
| 3 | |
March 4, 1793 | March 3, 1795 | Anti-Administration | |
| March 4, 1795 | March 3, 1797 | Democratic-Republican | |||
| 4 | | March 4, 1797 | March 3, 1801 | Federalist | |
| 5 | | March 4, 1801 | March 7, 1804 | Democratic-Republican | Died |
| 6 | | November 6, 1804 | May 14, 1810 | Democratic-Republican | Resigned to become associate justice of Maryland's 5th judicial circuit |
| 7 | | October 15, 1810 | March 3, 1815 | Democratic-Republican | |
| 8 | | March 4, 1815 | March 3, 1817 | Federalist | |
| 9 | | March 4, 1817 | March 3, 1821 | Democratic-Republican | |
| 10 |  | March 4, 1821 | March 3, 1823 | Democratic-Republican | |
| 11 | | March 4, 1823 | March 3, 1825 | Jacksonian Federalist | |
| 12 | | March 4, 1825 | March 3, 1827 | Adams | |
| 13 |  | March 4, 1827 | March 3, 1831 | Jacksonian | |
| 14 |  | March 4, 1831 | March 3, 1833 | Jacksonian | Redistricted to the 7th district |
| 15 | | March 4, 1833 | March 3, 1835 | Jacksonian |
1835–1843: Two seats
From 1835 to 1843, two seats were apportioned, elected at-large on a general ticket.
Seat A
| Name | Took office | Left office | Party | Notes/Events | |
|---|---|---|---|---|---|
| 16 |  | March 4, 1835 | March 3, 1837 | Jacksonian | |
| March 4, 1837 | March 3, 1839 | Democratic | |||
| 17 | | March 4, 1839 | March 3, 1841 | Democratic | |
| 18 |  | March 4, 1841 | March 3, 1843 | Whig |
Seat B
| Name | Took office | Left office | Party | Notes/Events | |
|---|---|---|---|---|---|
| 19 |  | March 4, 1835 | April 1, 1838 | Jacksonian | Redistricted from the 5th district, died |
| 20 |  | April 25, 1838 | March 3, 1839 | Whig | |
| 21 | | March 4, 1839 | March 3, 1841 | Democratic | |
| 22 | | March 4, 1841 | March 3, 1843 | Whig |
1843 - present: One seat
| Name | Took office | Left office | Party | Notes/Events | |
|---|---|---|---|---|---|
| 23 | | March 4, 1843 | March 3, 1845 | Whig | |
| 24 |  | March 4, 1845 | March 3, 1847 | Democratic | |
| 25 |  | March 4, 1847 | March 3, 1851 | Democratic | |
| 26 | | March 4, 1851 | March 3, 1853 | Whig | |
| 27 |  | March 4, 1853 | March 3, 1855 | Democratic | Redistricted from the 2nd district |
| 28 |  | March 4, 1855 | March 3, 1861 | American | |
| 29 | | March 4, 1861 | March 3, 1863 | Unionist | |
| 30 | |
March 4, 1863 | March 3, 1867 | Unconditional Unionist | Redistricted from the 5th district |
| March 4, 1867 | March 3, 1869 | Republican | |||
| 31 |  | March 4, 1869 | March 3, 1871 | Democratic | |
| 32 | | March 4, 1871 | March 3, 1873 | Democratic | |
| 33 |  | March 4, 1873 | March 3, 1879 | Democratic | Redistricted from the 3rd district |
| 34 | | March 4, 1879 | March 3, 1883 | Democratic | |
| 35 | | March 4, 1883 | March 3, 1887 | Democratic | |
| 36 |  | March 4, 1887 | March 3, 1889 | Democratic | |
| 37 | | March 4, 1889 | March 3, 1891 | Republican | |
| 38 | | March 4, 1891 | March 3, 1895 | Democratic | |
| 39 |  | March 4, 1895 | March 3, 1897 | Democratic | |
| 40 | | March 4, 1897 | March 3, 1899 | Republican | |
| 41 | | March 4, 1899 | March 3, 1901 | Democratic | |
| 42 |  | March 4, 1901 | March 3, 1903 | Republican | |
| 43 | | March 4, 1903 | March 3, 1905 | Democratic | |
| 44 | | March 4, 1905 | March 3, 1911 | Democratic | |
| 45 | 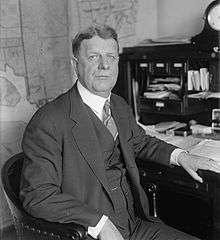 | March 4, 1911 | October 5, 1932 | Democratic | Died |
| 46 | 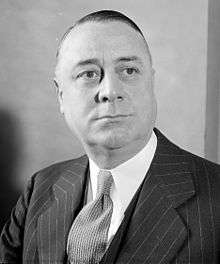 | November 8, 1932 | January 3, 1941 | Democratic | |
| 47 | | January 3, 1941 | January 3, 1943 | Democratic | |
| 48 | | January 3, 1943 | January 3, 1945 | Republican | |
| 49 | 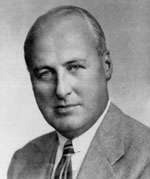 | January 3, 1945 | January 3, 1971 | Democratic | |
| 50 | 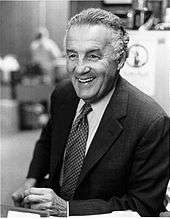 | January 3, 1971 | January 3, 1973 | Democratic | Redistricted to the 3rd district |
| 51 |  | January 3, 1973 | January 3, 1987 | Republican | |
| 52 |  | January 3, 1987 | January 3, 1993 | Democratic | |
| 53 |  | January 3, 1993 | May 31, 2008 | Democratic | Defeated in primary, resigned |
| 54 |  | June 17, 2008 | January 3, 2017 | Democratic | |
| 55 | .jpg) | January 3, 2017 | Democratic | Incumbent |
Historical district boundaries
See also
References
- ↑ "Partisan Voting Index – Districts of the 115th Congress" (PDF). The Cook Political Report. April 7, 2017. Retrieved April 7, 2017.
- ↑ http://clerk.house.gov/member_info/electionInfo/1970election.pdf
- ↑ http://clerk.house.gov/member_info/electionInfo/1972election.pdf
- ↑ http://clerk.house.gov/member_info/electionInfo/1974election.pdf
- ↑ http://clerk.house.gov/member_info/electionInfo/1976election.pdf
- ↑ http://clerk.house.gov/member_info/electionInfo/1978election.pdf
- ↑ http://clerk.house.gov/member_info/electionInfo/1980election.pdf
- ↑ http://clerk.house.gov/member_info/electionInfo/1982election.pdf
- ↑ http://clerk.house.gov/member_info/electionInfo/1984election.pdf
- ↑ http://clerk.house.gov/member_info/electionInfo/1986election.pdf
- ↑ http://clerk.house.gov/member_info/electionInfo/1988election.pdf
- ↑ http://clerk.house.gov/member_info/electionInfo/1990election.pdf
- ↑ http://clerk.house.gov/member_info/electionInfo/1992election.pdf
- ↑ http://clerk.house.gov/member_info/electionInfo/1994election.pdf
- ↑ http://clerk.house.gov/member_info/electionInfo/1996election.pdf
- ↑ http://clerk.house.gov/member_info/electionInfo/1998election.pdf
- 1 2 http://clerk.house.gov/member_info/electionInfo/2000election.pdf
- ↑ http://clerk.house.gov/member_info/electionInfo/2002election.pdf
- ↑ http://clerk.house.gov/member_info/electionInfo/2004election.pdf
- ↑ http://clerk.house.gov/member_info/electionInfo/2006election.pdf
- ↑ Elections, Maryland State Board of. "2008 Special 4th Congressional General Election Official Results". www.elections.state.md.us.
- ↑ http://clerk.house.gov/member_info/electionInfo/2008election.pdf
- ↑ http://clerk.house.gov/member_info/electionInfo/2010election.pdf
- ↑ "Official 2014 Gubernatorial General Election results for Representative in Congress". Maryland State Board of Elections. December 2, 2014. Retrieved March 29, 2015.
- ↑ Parsons, Stanley B., William W. Beach and Dan Hermann. United States Congressional Districts, 1788-1841 (Westport: Greenwood Press, 1978) p. 8-9
- ↑ Parsons. Congressional Districts. p. 42-43
- ↑ Parsons. Congressional Districts. p. 93-94