UCSF Chimera
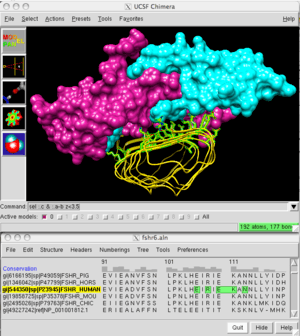 Chimera main window (FSH and receptor, 1xwd) and sequence window (alignment of FSH receptors from different species). | |
| Developer(s) | Resource for Biocomputing, Visualization, and Informatics (RBVI), UCSF |
|---|---|
| Stable release |
1.12
/ 24 October 2017 |
| Operating system | Microsoft Windows, OS X, Linux |
| Type | Molecular modelling |
| License | Free for noncommercial use |
| Website |
www |
UCSF Chimera (or simply Chimera) is an extensible program for interactive visualization and analysis of molecular structures and related data, including density maps, supramolecular assemblies, sequence alignments, docking results, trajectories, and conformational ensembles.[1] High-quality images and movies can be created. Chimera includes complete documentation and can be downloaded free of charge for noncommercial use.
Chimera is developed by the Resource for Biocomputing, Visualization, and Informatics (RBVI) at the University of California, San Francisco. Development is partially supported by the National Institutes of Health (NIGMS grant P41-GM103311). The next-generation program is UCSF ChimeraX.[2]
General structure analysis
- automatic identification of atom types
- hydrogen addition and partial charge assignment
- high-quality hydrogen bond, contact, and clash detection
- measurements: distances, angles, surface area, volume
- calculation of centroids, axes, planes and associated measurements
- amino acid rotamer libraries, protein Ramachandran plot, protein contact map
- structure building and bond rotation
- molecular dynamics trajectory playback (many formats), distance and angle plots
- morphing between conformations of a protein or even different proteins
- display of attributes (B-factor, hydrophobicity, etc.) with colors, radii, "worms"
- easy creation of custom attributes with simple text file inputs
- ViewDock tool to facilitate interactive screening of docking results
- rich set of commands, powerful specification syntax
- many formats read, PDB and Mol2 written
- Web and fetch from Protein Data Bank, CATH or SCOP (domains), EDS (density maps), EMDB (density maps), ModBase (comparative models), CASTp (protein pocket measurements), Pub3D (small molecule structures), VIPERdb (icosahedral virus capsids), UniProt (protein sequences with feature annotations), others
- interfaces to PDB2PQR charge/radius assignment, APBS electrostatics calculations, AutoDock Vina single-ligand docking
Presentation images and movies
- high-resolution images
- visual effects including depth-cueing, interactive shadows, silhouette edges, multicolor backgrounds
- standard molecular representations (sticks, spheres, ribbons, molecular surfaces)
- pipes-and-planks for helices and strands; nucleotide objects including lollipops and ladder rungs
- ellipsoids to show anisotropic B-factors
- nonmolecular geometric objects
- renderings of density maps and other volume data (see below)
- labeling with text, symbols, arrows, color keys
- different structures can be clipped differently and at any angle
- optional raytracing with bundled POV-Ray
- scene export to X3D and other formats
- simple graphical interface for creating movies interactively
- scenes can be placed as keyframes along an animation timeline
- alternatively, movie content and recording can be scripted; rich set of related commands
- movie recording is integrated with morphing and MD trajectory playback
Volume data tools
- many formats of volume data maps (electron density, electrostatic potential, others) read, several written
- interactive threshold adjustment, multiple isosurfaces (mesh or solid), transparent renderings
- fitting of atomic coordinates to maps and maps to maps
- density maps can be created from atomic coordinates
- markers can be placed in maps and connected with smooth paths
- display of individual data planes or multiple orthogonal planes
- volume data time series playback and morphing
- many tools for segmenting and editing maps
- Gaussian smoothing, Fourier transform, other filtering and normalization
- measurements: surface area, surface-enclosed volume, map symmetry, others
Sequence-structure tools
- many sequence alignment formats read, written
- sequence alignments can be created, edited
- sequences automatically associate with structures
- sequence-structure crosstalk: highlighting in one highlights the other
- protein BLAST search via Web service
- multiple sequence alignment via Clustal Omega and MUSCLE Web services
- interfaces to MODELLER for homology modeling and loop building
- structure superposition with or without pre-existing sequence alignment
- generation of structure-based sequence alignments from multiple superpositions
- several methods for calculating conservation and displaying values on associated structures
- RMSD header (histogram above the sequences) showing spatial variability of associated structures
- user-defined headers including histograms and colored symbols
- UniProt and CDD feature annotations shown as colored boxes on sequences
- trees in Newick format read/displayed
See also
| Wikimedia Commons has media related to UCSF Chimera. |
References
- ↑ Pettersen, EF; Goddard, TD; Huang, CC; Couch, GS; Greenblatt, DM; Meng, EC; Ferrin, TE (2004). "UCSF Chimera--a visualization system for exploratory research and analysis". J Comput Chem. 25 (13): 1605–12. doi:10.1002/jcc.20084.
- ↑ Goddard, T. D.; Huang, C. C.; Meng, E. C.; Pettersen, E. F.; Couch, G. S.; Morris, J. H.; Ferrin, T. E. (2017). "UCSF chimerax: meeting modern challenges in visualization and analysis". Protein Science. 27 (1). doi:10.1002/pro.3235.
External links
This article is issued from
Wikipedia.
The text is licensed under Creative Commons - Attribution - Sharealike.
Additional terms may apply for the media files.