The Maples (electoral district)
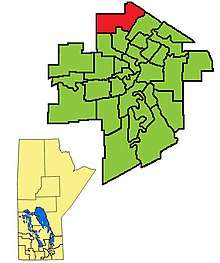 The 2011- boundaries for The Maples highlighted in red | |||
| Provincial electoral district | |||
| Legislature | Legislative Assembly of Manitoba | ||
| MLA |
Independent | ||
| District created | 1989 | ||
| First contested | 1990 | ||
| Last contested | 2016 | ||
| Demographics | |||
| Population (1996) | 19,234 | ||
| Census divisions | Winnipeg | ||
The Maples is a provincial electoral division in the Canadian province of Manitoba. The riding was created by redistribution in 1989, has been represented in the Legislative Assembly of Manitoba since the provincial election of 1990. It is located in the north end of Winnipeg. The riding is bordered by Kildonan to the east, Inkster to the west, Burrows to the south and Gimli to the north.
The riding's population in 1996 was 19,234. The average family income in 1999 was $45,853, with an unemployment rate of 9.30%. 25% of the riding's residents are categorized as low-income.
The Maples has the second-highest immigrant population in Manitoba, at 32.6% of the total. Its ethnic base is diverse; 12% of the riding's residents are Filipino, 8% are Ukrainian, 7% are East Indian, 3% are Italian, and a further 3% are Chinese. Manufacturing jobs accounted for 20% of the riding's industry in 1999.
Members of the Legislative Assembly
| Parliament | Years | Member | Party | |
|---|---|---|---|---|
| 35th | 1990-1993 | Gulzar Cheema | Liberal | |
| 1993-1995 | Gary Kowalski | Liberal | ||
| 36th | 1995-1997 | |||
| 1997-1998 | Independent | |||
| 1998-1999 | Liberal | |||
| 37th | 1999-2003 | Cris Aglugub | New Democrat | |
| 38th | 2003-2007 | |||
| 39th | 2007–2011 | Mohinder Saran | New Democrat | |
| 40th | 2011–2017 | |||
| 2017–present | Independent | |||
Electoral results
| Manitoba general election, 2016 | ||||||||
|---|---|---|---|---|---|---|---|---|
| Party | Candidate | Votes | % | ±% | Expenditures | |||
| New Democratic | Mohinder Saran | 2,832 | 36.24 | -15.59 | $29,088.30 | |||
| Progressive Conservative | Kaur Sidhu | 2,705 | 34.61 | +8.75 | $34,133.26 | |||
| Liberal | Harbans Singh Brar | 1,695 | 21.69 | +3.12 | $31,177.53 | |||
| Green | John Redekopp | 582 | 7.44 | +3.70 | $0 | |||
| Total valid votes/Expense limit | 7,814 | 100.0 | $44,346.00 | |||||
| Declined and rejected ballots | 122 | – | – | |||||
| Turnout | 7,936 | 55.63 | – | |||||
| Eligible voters | 14,265 | |||||||
| Source: Elections Manitoba[1][2][3] | ||||||||
| Manitoba general election, 2011 | ||||||||
|---|---|---|---|---|---|---|---|---|
| Party | Candidate | Votes | % | ±% | Expenditures | |||
| New Democratic | Mohinder Saran | 3,894 | 51.83 | −3.81 | $26562.23 | |||
| Progressive Conservative | Jose Tomas | 1,943 | 25.86 | −3.29 | $36087.69 | |||
| Liberal | Pablito Sarinas | 1,395 | 18.57 | +4.30 | $829.64 | |||
| Green | John Redekopp | 281 | 3.74 | – | $299.89 | |||
| Total valid votes | 7,513 | 100.00 | ||||||
| Rejected and declined votes | 49 | |||||||
| Turnout | 7,562 | 54.91 | −0.14 | |||||
| Registered voters | 13,772 | |||||||
| Manitoba general election, 2007 | ||||||||
|---|---|---|---|---|---|---|---|---|
| Party | Candidate | Votes | % | ±% | Expenditures | |||
| New Democratic | Mohinder Saran | 3,617 | 55.64 | −12.47 | $24,669.15 | |||
| Progressive Conservative | Lou Fernandez | 1,895 | 29.15 | +13.21 | $17,646.04 | |||
| Liberal | Pritam Brar | 928 | 14.27 | −1.64 | $21,652.60 | |||
| Total valid votes | 6,440 | 99.06 | ||||||
| Rejected and declined votes | 61 | |||||||
| Turnout | 6,501 | 55.05 | +5.94 | |||||
| Registered voters | 11,809 | |||||||
| Manitoba general election, 2003 | ||||||||
|---|---|---|---|---|---|---|---|---|
| Party | Candidate | Votes | % | ±% | Expenditures | |||
| New Democratic | Cris Aglugub | 3,781 | 68.11 | +13.98 | $17,536.04 | |||
| Liberal | Angelina Olivier-Job | 885 | 15.94 | +0.52 | $4,237.43 | |||
| Progressive Conservative | Tammy Witko | 885 | 15.94 | −12.94 | $801.41 | |||
| Total valid votes | 5,551 | 100.00 | ||||||
| Rejected and declined votes | 33 | |||||||
| Turnout | 5,584 | 49.11 | −20.45 | |||||
| Registered voters | 11,371 | |||||||
| Manitoba general election, 1999 | ||||||||
|---|---|---|---|---|---|---|---|---|
| Party | Candidate | Votes | % | ±% | Expenditures | |||
| New Democratic | Cris Aglugub | 4,329 | 54.13 | $24,398.00 | ||||
| Progressive Conservative | Ellen Kowalski | 2,310 | 28.88 | $29,457.64 | ||||
| Liberal | Sudhir Sandhu | 1,233 | 15.42 | – | $24,842.64 | |||
| Independent | Caneda Menard | 73 | 0.91 | $0.00 | ||||
| Total valid votes | 7,945 | 99.34 | ||||||
| Rejected and declined votes | 53 | |||||||
| Turnout | 7,998 | 69.56 | ||||||
| Registered voters | 11,498 | |||||||
| Manitoba general election, 1995 | ||||||||
|---|---|---|---|---|---|---|---|---|
| Party | Candidate | Votes | % | ±% | ||||
| Liberal | Gary Kowalski | 4,254 | 48.08 | +8.25 | ||||
| New Democratic | Inderjit Claire | 2,634 | 29.77 | +2.27 | ||||
| Progressive Conservative | Fred Arrojado | 1,960 | 22.15 | -10.51 | ||||
| Total valid votes | , | 100.00 | - | |||||
| Rejected and declined ballots | 48 | – | – | |||||
| Turnout | 8,896 | 66.38 | ||||||
| Eligible voters | 13,402 | |||||||
| Source: Elections Manitoba[7] | ||||||||
| The Maples by-election 1993 election | ||||||||
|---|---|---|---|---|---|---|---|---|
| Party | Candidate | Votes | % | ±% | ||||
| Liberal | Gary Kowalski | 3,619 | 50.84 | +11.01 | ||||
| New Democratic | Norma Walker | 2,138 | 30.03 | +2.53 | ||||
| Progressive Conservative | David Langtry | 1,362 | 19.13 | -13.53 | ||||
| Total valid votes | 7,119 | 100.00 | - | |||||
| Rejected and declined ballots | – | – | ||||||
| Turnout | ||||||||
| Eligible voters | ||||||||
| Manitoba general election, 1990 | ||||||||
|---|---|---|---|---|---|---|---|---|
| Party | Candidate | Votes | % | |||||
| Liberal | Gulzar Singh Cheema | 3,273 | 39.83 | |||||
| Progressive Conservative | Norman Isler | 2,684 | 32.66 | |||||
| New Democratic | Tony Valeri | 2,260 | 27.50 | |||||
| Total valid votes | 8,217 | 100.00 | - | |||||
| Rejected ballots | 36 | |||||||
| Turnout | 8,253 | 67.00 | ||||||
| Eligible voters | 12,318 | |||||||
| Source: Elections Manitoba[8] | ||||||||
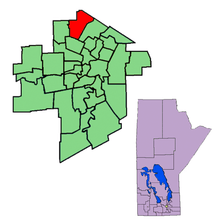
Previous boundaries
References
- ↑ "Candidates: 41st General Election". Elections Manitoba. 29 March 2016. Retrieved 31 March 2016.
- ↑ "41ST GENERAL ELECTION, APRIL 19, 2016 - OFFICIAL RESULTS". Elections Manitoba. 19 April 2016. Retrieved 18 November 2016.
- ↑ "Election Returns: 41st General Election". Elections Manitoba. 2016. Retrieved 23 August 2018.
- ↑ http://www.electionsmanitoba.ca/en/Results/39_division_results/39_the-maples_summary_results.html - 2007 results
- ↑ http://www.elections.mb.ca/en/Results/38_division_results/38_the-maples_summary_results.html - 2003 results
- ↑ http://www.electionsmanitoba.ca/apps/results/37gen/pbp.asp?ED=50 - 1999 results
- ↑ "Candidates: 36th General Election" (PDF). Elections Manitoba. 25 April 1995. Retrieved 27 September 2018.
- ↑ "Candidates: 35th General Election" (PDF). Elections Manitoba. September 11, 1990. Retrieved 27 September 2018.