Thabo Mofutsanyana District Municipality
| Thabo Mofutsanyane | ||
|---|---|---|
| District municipality | ||
| ||
.svg.png) Location of Thabo Mofutsanyana District Municipality within Free State | ||
| Coordinates: 28°32′S 28°49′E / 28.533°S 28.817°ECoordinates: 28°32′S 28°49′E / 28.533°S 28.817°E | ||
| Country | South Africa | |
| Province | Free State | |
| Seat | Phuthaditjhaba | |
| Local municipalities | ||
| Government[1] | ||
| • Type | Municipal council | |
| • Mayor | Dr. Balekile Edward Mzangwa (ANC) | |
| Area | ||
| • Total | 33,269 km2 (12,845 sq mi) | |
| Population (2011)[2] | ||
| • Total | 736,238 | |
| • Density | 22/km2 (57/sq mi) | |
| Racial makeup (2011)[2] | ||
| • Black African | 93.8% | |
| • Coloured | 0.8% | |
| • Indian/Asian | 0.4% | |
| • White | 4.8% | |
| First languages (2011)[3] | ||
| • Sotho | 78.5% | |
| • Zulu | 10.4% | |
| • Afrikaans | 6.0% | |
| • English | 2.0% | |
| • Other | 3.1% | |
| Time zone | UTC+2 (SAST) | |
| Municipal code | DC19 | |
Thabo Mofutsanyana is one of the 5 districts of the Free State province of South Africa. The seat of Thabo Mofutsanyana is Witsieshoek. The majority of its 725 932 people speak Sesotho (2001 Census). The district code is DC19
Geography
Neighbours
Thabo Mofutsanyana is surrounded by:
- Fezile Dabi to the north (DC20)
- Gert Sibande in Mpumalanga to the north-east (DC30)
- Amajuba in Kwa-Zulu Natal to the east (DC25)
- Uthukela to the south-east (DC23)
- The kingdom of Lesotho to the south
- Mangaung Metro to the south-west
- Lejweleputswa to the west (DC18)
Local municipalities
The district contains the following local municipalities:
| Local municipality | Population | % | Dominant language |
|---|---|---|---|
| Maluti-a-Phofung | 335 784 | 45.61% | Sotho |
| Dihlabeng | 128 704 | 17.48% | Sotho |
| Setsoto | 112 597 | 15.29% | Sotho |
| Nketoana | 60 324 | 8.19% | Sotho |
| Mantsopa | 51 056 | 6.93% | Sotho |
| Phumelela | 47 772 | 6.49% | Zulu |
| Golden Gate Highlands National Park | 1 | 0.01% |
Demographics
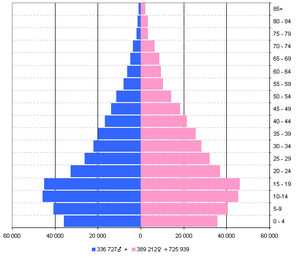
Chart showing population by age and gender for Thabo Mofutsanyana
The following statistics are from the 2001 census.
| Language | Population | % |
|---|---|---|
| Sesotho | 586 022 | 80.73% |
| IsiZulu | 90 584 | 12.48% |
| Afrikaans | 32 478 | 4.47% |
| IsiXhosa | 4 848 | 0.67% |
| English | 4 805 | 0.66% |
| SiSwati | 1 909 | 0.26% |
| IsiNdebele | 1 549 | 0.21% |
| Setswana | 1 520 | 0.21% |
| Sepedi | 1 110 | 0.15% |
| Other | 648 | 0.09% |
| Xitsonga | 357 | 0.05% |
| Tshivenda | 110 | 0.02% |
Gender
| Gender | Population | % |
|---|---|---|
| Female | 389 210 | 53.62% |
| Male | 336 722 | 46.38% |
Ethnic group
| Ethnic group | Population | % |
|---|---|---|
| Black African | 690 852 | 95.17% |
| White | 30 194 | 4.16% |
| Coloured | 3 601 | 0.50% |
| Indian/Asian | 1 285 | 0.18% |
Politics
Election results
Election results for Thabo Mofutsanyana in the South African general election, 2004.
- Population 18 and over: 425 922 [58.67% of total population]
- Total votes: 260 796 [35.93% of total population]
- Voting % estimate: 61.23% votes as a % of population 18 and over
| Party | Votes | % |
|---|---|---|
| African National Congress | 225 688 | 86.54% |
| Democratic Alliance | 14 214 | 5.45% |
| Pan African Congress | 5 135 | 1.97% |
| African Christian Democratic Party | 2 836 | 1.09% |
| Freedom Front Plus | 2 756 | 1.06% |
| United Democratic Movement | 2 409 | 0.92% |
| Inkhata Freedom Party | 1 978 | 0.76% |
| New National Party | 1 557 | 0.60% |
| Independent Democrats | 876 | 0.34% |
| Azanian People's Organisation | 704 | 0.27% |
| United Christian Democratic Party | 525 | 0.20% |
| SOPA | 386 | 0.15% |
| NA | 310 | 0.12% |
| EMSA | 292 | 0.11% |
| UF | 242 | 0.09% |
| CDP | 228 | 0.09% |
| PJC | 214 | 0.08% |
| TOP | 172 | 0.07% |
| KISS | 116 | 0.04% |
| NLP | 93 | 0.04% |
| Minority Front | 65 | 0.02% |
| Total | 260 796 | 100.00% |
References
- ↑ "Contact list: Executive Mayors". Government Communication & Information System. Archived from the original on 14 July 2010. Retrieved 22 February 2012.
- 1 2 "Statistics by place". Statistics South Africa. Retrieved 27 September 2015.
- ↑ "Statistics by place". Statistics South Africa. Retrieved 27 September 2015.
External links
.svg.png)
This article is issued from
Wikipedia.
The text is licensed under Creative Commons - Attribution - Sharealike.
Additional terms may apply for the media files.