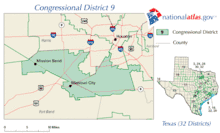
Texas's 9th congressional district
| Texas's 9th congressional district | |
|---|---|
.tif.png) Texas's 9th congressional district - since January 3, 2013. | |
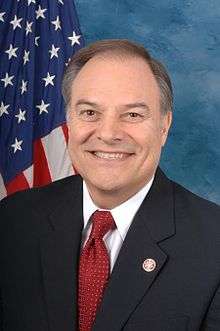
| Current Representative | Al Green (D–Houston) |
| Distribution |
|
| Population (2016) | 793,923[2] |
| Median income | $46,048 |
| Ethnicity |
|
| Cook PVI | D+29[3] |
Texas District 9 of the United States House of Representatives is a Congressional district that serves the southwestern portion of the Greater Houston area in Texas. The current Representative for the district, since 2005, is Democrat Al Green.
Before 2005, the 9th covered an area stretching from Galveston through Houston to Beaumont. Much of that area is now the 2nd District. Most of the area now in the 9th was in the 25th District from 1983 to 2005.
List of representatives
| Representative | Party | Term | Note |
|---|---|---|---|
| District created | March 4, 1883 | ||
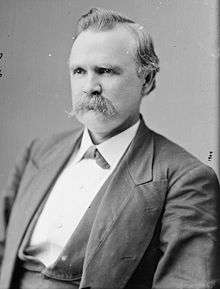 |
Democratic | March 4, 1883 – March 23, 1892 | Redistricted from the 4th district, resigned after being elected to the US Senate |
| Vacant | March 23, 1892 – June 14, 1892 | ||
 |
Democratic | June 14, 1892 - March 3, 1893 | |
 |
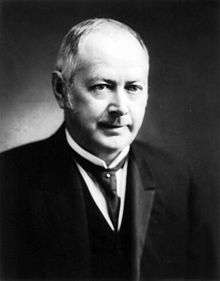
Democratic | March 4, 1893 - January 16, 1899 | Redistricted from the 10th district, Resigned after being elected Governor |
| Vacant | January 16, 1899 – March 4, 1899 | ||
 |
Democratic | March 4, 1899 - March 3, 1903 | Redistricted to the 10th district |
 |
Democratic | March 4, 1903 - March 3, 1917 | Redistricted from the 10th district |
 |
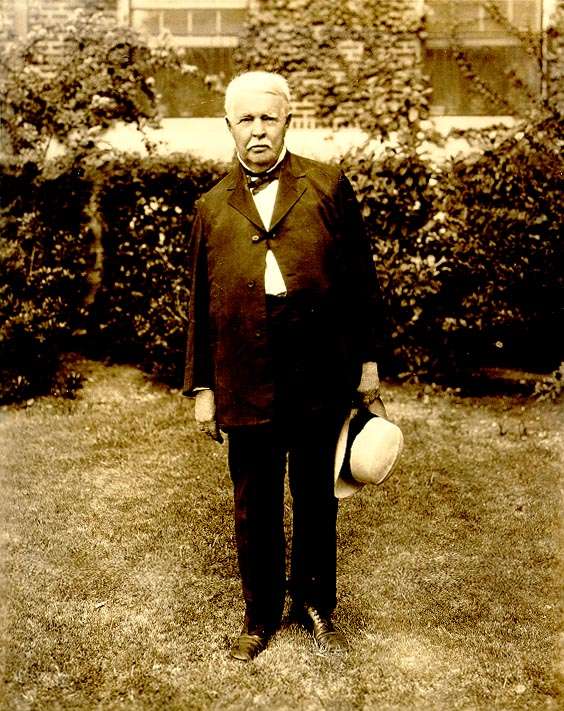
Democratic | March 4, 1917 - July 12, 1947 | Died |
| Vacant | July 12, 1947 – August 23, 1947 | ||
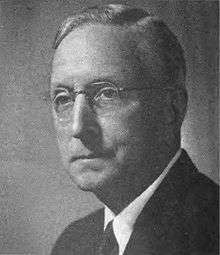 |
Democratic | August 23, 1947 - December 30, 1966 | Resigned |
| Vacant | December 30, 1966 – January 3, 1967 | ||
 |
Democratic | January 3, 1967 - January 3, 1995 | Redistricted from the 2nd district |
 |
Republican | January 3, 1995 - January 3, 1997 | |
 |
Democratic | January 3, 1997 - January 3, 2005 | |
.jpg) |
Democratic | January 3, 2005 – Present | Incumbent |
Election results
| Party | Candidate | Votes | % | ± | |
|---|---|---|---|---|---|
| Democratic | Al Green | 114,462 | 72.2 | +13.6 | |
| Republican | Arlette Molina | 42,132 | 26.6 | -13.7 | |
| Libertarian | Stacey Bourland | 1,972 | 1.2 | +0.2 | |
| Majority | 72,330 | 45.6 | |||
| Turnout | 158,566 | ||||
| Democratic hold | Swing | +13.7 | |||
| Party | Candidate | Votes | % | ± | |
|---|---|---|---|---|---|
| Democratic | Al Green | 60,253 | 100 | +27.8 | |
| Majority | 60,253 | 100 | |||
| Turnout | 60,253 | ||||
| Democratic hold | Swing | +54.4 | |||
| Party | Candidate | Votes | % | ± | |
|---|---|---|---|---|---|
| Democratic | Al Green | 113,380 | 93.3 | -6.7 | |
| Libertarian | Brad Walters | 8,089 | 6.7 | +6.7 | |
| Majority | 105,291 | 86.6 | |||
| Turnout | 121,469 | ||||
| Democratic hold | Swing | -13.4 | |||
| Party | Candidate | Votes | % | ± | |
|---|---|---|---|---|---|
| Democratic | Al Green | 62,616 | 74.2 | -19.1 | |
| Republican | Steve Mueller | 20,498 | 24.3 | +24.3 | |
| Libertarian | Michael W. Hope | 1,250 | 1.5 | -5.2 | |
| Majority | 42,118 | 49.9 | |||
| Turnout | 84,364 | ||||
| Democratic hold | Swing | -36.7 | |||
Historical district boundaries
From 1967 to 2005 the district included the Johnson Space Center, and from 1935 to 2005 it took in Galveston.
See also
References
- ↑ https://www.census.gov/geo/maps-data/data/cd_state.html
- ↑ https://www.census.gov/mycd/?st=48&cd=09
- ↑ "Partisan Voting Index – Districts of the 115th Congress" (PDF). The Cook Political Report. April 7, 2017. Retrieved April 7, 2017.
- Martis, Kenneth C. (1989). The Historical Atlas of Political Parties in the United States Congress. New York: Macmillan Publishing Company.
- Martis, Kenneth C. (1982). The Historical Atlas of United States Congressional Districts. New York: Macmillan Publishing Company.
- Congressional Biographical Directory of the United States 1774–present
Coordinates: 29°38′44″N 95°29′39″W / 29.64556°N 95.49417°W
This article is issued from
Wikipedia.
The text is licensed under Creative Commons - Attribution - Sharealike.
Additional terms may apply for the media files.