Swedish general election, 2002
|
| |||||||||||||||||||||||||||||||||||||||||||||||||||||||||||||||||||||||||||||||||||||||||||||||||||||||||||||||||||||||
| |||||||||||||||||||||||||||||||||||||||||||||||||||||||||||||||||||||||||||||||||||||||||||||||||||||||||||||||||||||||
All 349 seats to the Riksdag 175 seats were needed for a majority | |||||||||||||||||||||||||||||||||||||||||||||||||||||||||||||||||||||||||||||||||||||||||||||||||||||||||||||||||||||||
|---|---|---|---|---|---|---|---|---|---|---|---|---|---|---|---|---|---|---|---|---|---|---|---|---|---|---|---|---|---|---|---|---|---|---|---|---|---|---|---|---|---|---|---|---|---|---|---|---|---|---|---|---|---|---|---|---|---|---|---|---|---|---|---|---|---|---|---|---|---|---|---|---|---|---|---|---|---|---|---|---|---|---|---|---|---|---|---|---|---|---|---|---|---|---|---|---|---|---|---|---|---|---|---|---|---|---|---|---|---|---|---|---|---|---|---|---|---|---|---|
| |||||||||||||||||||||||||||||||||||||||||||||||||||||||||||||||||||||||||||||||||||||||||||||||||||||||||||||||||||||||
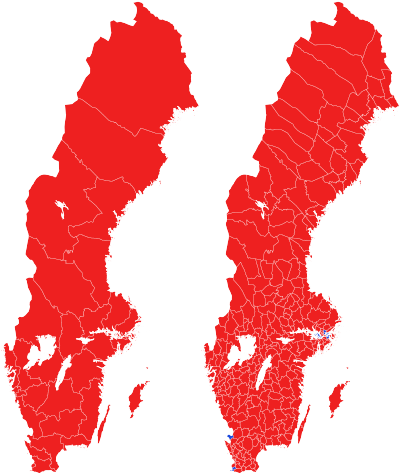 Largest party by district (left) and municipality (right) Red-Social Democratic, Blue-Moderate | |||||||||||||||||||||||||||||||||||||||||||||||||||||||||||||||||||||||||||||||||||||||||||||||||||||||||||||||||||||||
| |||||||||||||||||||||||||||||||||||||||||||||||||||||||||||||||||||||||||||||||||||||||||||||||||||||||||||||||||||||||


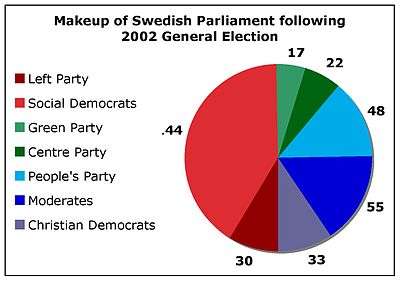
General elections were held in Sweden on 15 September 2002,[1] alongside municipal and county council elections. The Swedish Social Democratic Party remained the largest party in the Riksdag, winning 144 of the 349 seats,[2] while the Liberal People's Party gained the most votes.
Results
| Final results of the 2002 Swedish general election |
Votes | Seats | ||||
|---|---|---|---|---|---|---|
| # | % | +/- | # | +/- | ||
| Social Democrats (s) | 2,113,560 | 39.85 | +3.46 | 144 | +13 | |
| Moderate Party (m) | 809,041 | 15.26 | −7.64 | 55 | −27 | |
| Liberal People's Party (fp) | 710,312 | 13.39 | +8.67 | 48 | +31 | |
| Christian Democrats (kd) | 485,235 | 9.15 | −2.62 | 33 | −9 | |
| Left Party (v) | 444,854 | 8.39 | −3.60 | 30 | −13 | |
| Centre Party (c) | 328,428 | 6.19 | +1.06 | 22 | +4 | |
| Green Party (mp) | 246,392 | 4.65 | +0.16 | 17 | +1 | |
| Sweden Democrats (sd) | 76,300 | 1.44 | +1.07 | 0 | – | |
| Swedish Senior Citizen Interest Party (spi) | 37,573 | 0.71 | +0.29 | 0 | – | |
| Norrbotten Party | 14,854 | 0.28 | +0.28 | 0 | – | |
| New Future | 9,337 | 0.18 | +0.01 | 0 | – | |
| National Democrats (nd) | 9,248 | 0.17 | +0.17 | 0 | – | |
| Skåne Party | 4,564 | 0.09 | +0.09 | 0 | – | |
| Socialist Party | 3,213 | 0.06 | +0.03 | 0 | – | |
| New Democracy¹ (nyd) | 2,207 | 0.04 | −0.11 | 0 | – | |
| Socialist Justice Party (rs) | 1,519 | 0.03 | −0.03 | 0 | – | |
| Communist Party of Sweden (skp) | 1,182 | 0.02 | −0.01 | 0 | – | |
| Unity | 603 | 0.01 | -0.02 | 0 | – | |
| Free List | 502 | 0.01 | +0.01 | 0 | – | |
| Voice of the Free People | 207 | 0.00 | – | 0 | – | |
| European Workers Party | 163 | 0.00 | ±0 | 0 | – | |
| Welfare Party | 94 | 0.00 | – | 0 | – | |
| National Democratic Party of Sweden | 87 | 0.00 | – | 0 | – | |
| Alliance Party | 58 | 0.00 | ±0 | 0 | – | |
| Skåne Federalists | 52 | 0.00 | – | 0 | – | |
| Communist League | 46 | 0.00 | ±0 | 0 | – | |
| Citizens Party | 27 | 0.00 | ±0 | 0 | – | |
| Rikshushållarna | 17 | 0.00 | – | 0 | – | |
| Republicans | 15 | 0.00 | ±0 | 0 | – | |
| Tax Reformists | 14 | 0.00 | – | 0 | – | |
| Popular Democrats | 12 | 0.00 | ±0 | 0 | – | |
| Populist Party | 11 | 0.00 | – | 0 | – | |
| New Swedes D.P.N.S. | 11 | 0.00 | – | 0 | – | |
| Donald Duck Party | 10 | 0.00 | – | 0 | – | |
| Parties with less than 10 votes | 69 | 0.00 | ||||
| Valid votes | 5,303,212 | 98.47 | ||||
| Invalid votes | 82,218 | 1.53 | ||||
| Turnout | 5,385,430 | 80.11 | −1.28 | |||
¹ New Democracy was actually dissolved by the time of the election and did not run, but some voters wrote the party name on an empty ballot anyway.
By municipality
 Votes by municipality. The municipalities are the color of the party that got the most votes within the coalition that won relative majority.
 Cartogram of the map to the left with each municipality rescaled to the number of valid votes cast.
 Map showing the voting shifts from the 1998 to the 2002 election. Darker blue indicates a municipality voted more towards the parties that formed the centre-right bloc. Darker red indicates a municipality voted more towards the parties that form the left-wing bloc.
 Votes by municipality as a scale from red/Left-wing bloc to blue/Centre-right bloc.
 Cartogram of vote with each municipality rescaled in proportion to number of valid votes cast. Deeper blue represents a relative majority for the centre-right coalition, brighter red represents a relative majority for the left-wing coalition.
References
Further reading
- Madeley, John T. S. (April 2003). "'The Swedish model is dead! Long live the Swedish model!' The 2002 Riksdag election". West European Politics. 26 (2): 165–173. doi:10.1080/01402380512331341161.
This article is issued from
Wikipedia.
The text is licensed under Creative Commons - Attribution - Sharealike.
Additional terms may apply for the media files.