St Albans City and District Council elections
One third of St Albans City and District Council in Hertfordshire, England is elected each year, followed by one year without election. Since the last boundary changes in 1999, 58 councillors have been elected from 20 wards.[1]
Political control
Since the first election to the council in 1973 political control of the council has been held by the following parties:[2]
| Party in control | Years |
|---|---|
| Conservative | 1973 – 1984 |
| No overall control | 1984 - 1988 |
| Conservative | 1988 – 1991 |
| No overall control | 1991 - 1994 |
| Liberal Democrats | 1994 – 1999 |
| No overall control | 1999 - 2006 |
| Liberal Democrats | 2006 – 2007 |
| No overall control | 2007 - 2008 |
| Liberal Democrats | 2008 – 2011 |
| No overall control | 2011 - 2015 |
| Conservative | 2015 – Present |
Council elections
Summary of the council composition after recent council elections, click on the year for full details of each election. Boundary changes took place for the 1999 election increasing the number of seats by 1.[3]
- St Albans City and District Council election, 1973
- St Albans City and District Council election, 1976
- St Albans City and District Council election, 1979 (New ward boundaries)[4]
- St Albans City and District Council election, 1980
- St Albans City and District Council election, 1982
- St Albans City and District Council election, 1983
- St Albans City and District Council election, 1984
- St Albans City and District Council election, 1986
- St Albans City and District Council election, 1987
- St Albans City and District Council election, 1988
| Year | Conservative | Liberal Democrats | Labour | Independent | Green | Vacant | Notes |
|---|---|---|---|---|---|---|---|
| 1990[5] | 31 | 17 | 8 | 1 | 0 | 0 | |
| 1991[6] | 27 | 20 | 9 | 1 | 0 | 0 | |
| 1992[7] | 23 | 23 | 10 | 1 | 0 | 0 | |
| 1994[8] | 19 | 29 | 9 | 0 | 0 | 0 | |
| 1995[9] | 13 | 34 | 10 | 0 | 0 | 0 | |
| 1996[10] | 5 | 39 | 11 | 1 | 0 | 1 | |
| 1998[11] | 11 | 30 | 16 | 0 | 0 | 0 | |
| 1999[3] | 21 | 21 | 16 | 0 | 0 | 0 | New ward boundaries[12] |
| 2000[13] | 19 | 23 | 15 | 1 | 0 | 0 | |
| 2002[14] | 20 | 21 | 15 | 1 | 0 | 1 | |
| 2003[15] | 21 | 23 | 13 | 1 | 0 | 0 | |
| 2004[16] | 17 | 29 | 11 | 1 | 0 | 0 | |
| 2006[17] | 17 | 31 | 8 | 2 | 0 | 0 | |
| 2007[18] | 19 | 29 | 8 | 2 | 0 | 0 | Some new ward boundaries[19] |
| 2008[20] | 22 | 30 | 5 | 1 | 0 | 0 | |
| 2010[21] | 24 | 30 | 3 | 1 | 0 | 0 | |
| 2011[22] | 29 | 24 | 3 | 1 | 1 | 0 | |
| 2012[23] | 29 | 19 | 8 | 1 | 1 | 0 | |
| 2014[2] | 29 | 17 | 10 | 1 | 1 | 0 | |
| 2015 | 32 | 16 | 8 | 1 | 1 | ||
| 2016 | 31 | 17 | 7 | 2 | 1 | 0 | |
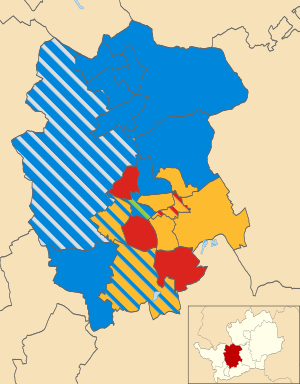
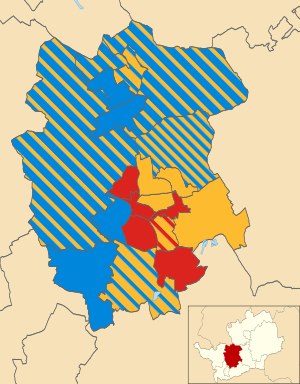
District result maps
 1999 results map
 2000 results map
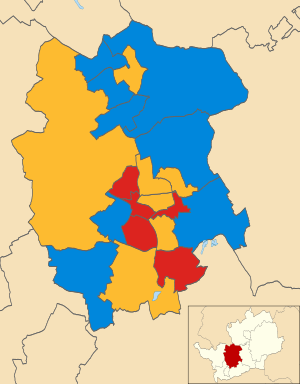 2002 results map
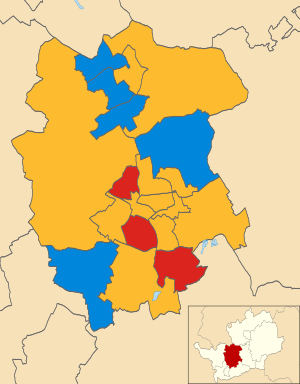 2003 results map
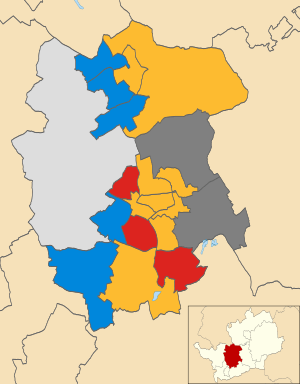 2004 results map
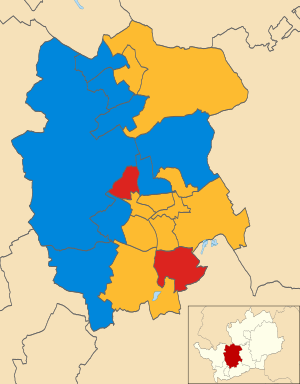 2006 results map
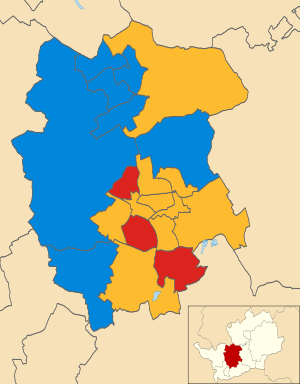 2007 results map
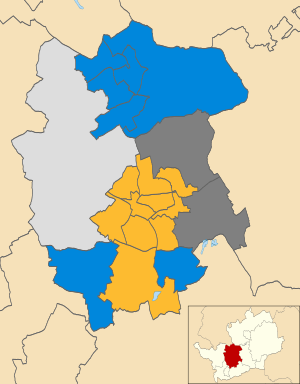 2008 results map
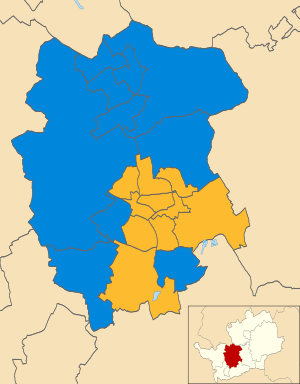 2010 results map
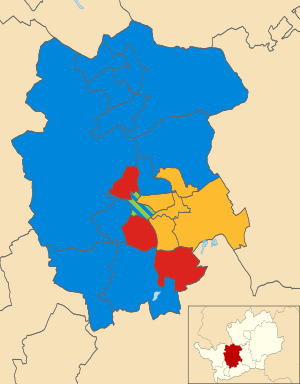 2011 results map
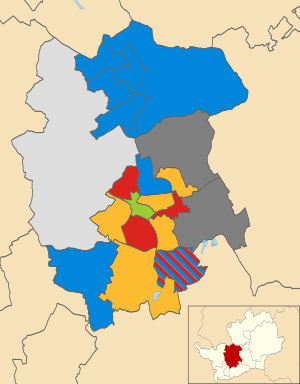 2012 results map
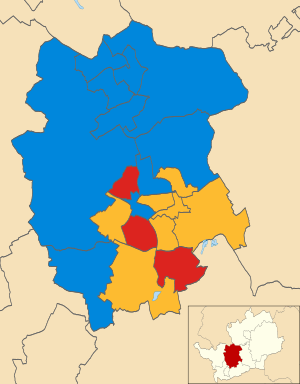 2014 results map
By-election results
By-elections occur when seats become vacant between council elections. Below is a summary of recent by-elections;[24] full by-election results can be found by clicking on the by-election name.
| By-election | Date | Incumbent party | Winning party | ||
|---|---|---|---|---|---|
| Sopwell | 13 June 1996 | Labour | Labour | ||
| Marshalswick North | 27 February 1997 | Liberal Democrat | Liberal Democrat | ||
| Sopwell by-election | 23 July 1998 | Labour | Labour | ||
| Verulam by-election | 2 December 1999 | Conservative | Conservative | ||
| Park Street by-election | 12 October 2000 | Liberal Democrat | Liberal Democrat | ||
| Sopwell by-election | 7 June 2001 | Labour | Labour | ||
| Verulam by-election | 27 June 2002 | Conservative | Liberal Democrat | ||
| Verulam by-election | 5 April 2004 | Conservative | Liberal Democrat | ||
| Harpenden South by-election | 4 June 2009 | Conservative | Conservative | ||
| Ashley by-election | 3 June 2010 | Liberal Democrat | Liberal Democrat | ||
| Batchwood by-election | 19 January 2012 | Liberal Democrat | Labour | ||
| Marshalswick South by-election | 29 January 2015 | Conservative | Conservative | ||
References
- ↑ "Election results". St Albans City & District Council. Retrieved 6 January 2015.
- 1 2 "St Albans". BBC News Online. Retrieved 6 January 2015.
- 1 2 "St Albans". BBC News Online. Retrieved 6 January 2015.
- ↑ The City of St Albans (Electoral Arrangements) Order 1978
- ↑ "Local election results". The Times. NewsBank. 5 May 1990.
- ↑ "Complete round-up of results from Thursday's local council elections". The Times. NewsBank. 4 May 1991.
- ↑ "Local election results 1992". The Times. NewsBank. 9 May 1992.
- ↑ "Non Metropolitan Districts - Local elections". The Times. NewsBank. 7 May 1994. p. 9.
- ↑ "Complete list of results from thursday's council elections - Council elections". The Times. NewsBank. 6 May 1995.
- ↑ "Complete list of results - Elections". The Times. NewsBank. 4 May 1996. p. 8.
- ↑ "Local Elections results". The Times. NewsBank. 9 May 1998. p. 46.
- ↑ legislation.gov.uk - The City of St Albans (Electoral Changes) Order 1998. Retrieved on 4 October 2015.
- ↑ "St Albans". BBC News Online. Retrieved 6 January 2015.
- ↑ "St Albans". BBC News Online. Retrieved 6 January 2015.
- ↑ "Local elections". BBC News Online. Retrieved 6 January 2015.
- ↑ "St Albans council". BBC News Online. 11 June 2004. Retrieved 6 January 2015.
- ↑ Lewis, Alex (5 May 2006). "'Life made easier' for Lib Dems". Hertfordshire County Publications. NewsBank.
- ↑ "St Albans". BBC News Online. 4 May 2007. Retrieved 6 January 2015.
- ↑ legislation.gov.uk - The St Albans (Parish Electoral Arrangements and Electoral Changes) Order 2007. Retrieved on 3 November 2015.
- ↑ "St Albans". BBC News Online. 2 May 2008. Retrieved 6 January 2015.
- ↑ "St Albans". BBC News Online. 11 May 2010. Retrieved 6 January 2015.
- ↑ "England council elections". BBC News Online. 10 May 2011. Retrieved 6 January 2015.
- ↑ "St Albans". BBC News Online. 4 May 2012. Retrieved 6 January 2015.
- ↑ "Local Authority Byelection Results". Retrieved 6 January 2015.