St. Norbert is a provincial electoral division in the Canadian province of Manitoba.
Historical riding
The original riding of St. Norbert was established at the time of the province's creation in 1870. For the 1870 provincial election, it was divided into two separate ridings: St. Norbert North and St. Norbert South. Subsequently, it was reduced to a single riding.
St. Norbert was a francophone-majority riding. It was eliminated in 1879, at a time when francophone representation in the province was being reduced.
List of provincial representatives (St. Norbert North)
| Name |
Party |
Took office |
Left office |
| Joseph Lemay |
Government/French Party |
1870 |
1874 |
List of provincial representatives (St. Norbert South)
| Name |
Party |
Took office |
Left office |
| Pierre Delorme |
Government/French Party |
1870 |
1874 |
List of provincial representatives (St. Norbert)
Current riding
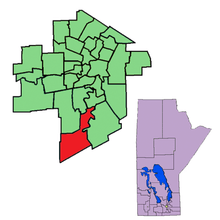
It was created by redistribution in 1979, and has officially existed since the provincial election of 1981. The riding is located in the southernmost tip of the City of Winnipeg.
St. Norbert is bordered to the east by Seine River, to the south and west by the rural ridings of Dawson Trail and Morris (respectively), and to the north by Riel, Fort Garry and Fort Whyte. The riding's character is suburban.
St. Norbert's population in 1996 was 19,184. In 1999, the average family income was $59,444, and the unemployment rate was 8.20%. The riding is ethnically diverse: 5% of the riding's residents are German, 4% are Chinese, 3% are East Indian and 2% are Italian. Six per cent of the riding's residents are francophone. Almost 28% of the riding's residents have a university degree.
The service sector accounts for 16% of St. Norbert's industry, with a further 15% in the educational services.
List of provincial representatives
Electoral results
| Manitoba general election, 2016 |
| Party |
Candidate |
Votes | % | ±% | Expenditures |
|
Progressive Conservative | Jon Reyes | 4,673 | 51.02 | +6.43 | $36,660.34 |
|
New Democratic | Dave Gaudreau | 3,062 | 33.43 | −11.51 | $24,532.06 |
|
Liberal | James Bloomfield | 1,251 | 13.66 | +3.65 | $38,985.78 |
|
Independent | Narinder Kaur Johar | 174 | 0.19 | | $5,367.70 |
| Total valid votes/Expense limit |
9160 | 98.56 | | $44,386.00 |
| Total rejected ballots |
134 | 1.44 | |
| Turnout |
9,294 | 65.09 | +0.84 |
| Eligible voters |
14,278 | | |
| Source: Elections Manitoba[1][2] |
[4]
| Manitoba general election, 2007 |
| Party |
Candidate |
Votes | % | ±% | Expenditures |
|
New Democratic | Marilyn Brick | 4,044 | 53.74 | +9.08 | $18,993.62 |
| |
Progressive Conservative |
Tara Brousseau |
2,404 |
31.94 |
−5.93 |
$28,159.72 |
|
Liberal | Wendy Bloomfield | 1,077 | 14.31 | +3.58 | $19,690.78 |
| Total valid votes |
7,525 |
100.00 |
|
| Rejected and declined votes |
38 |
|
|
| Turnout |
7,563 |
65.45 |
|
| Registered voters |
11,555 |
|
|
[5]
[6]
| Manitoba general election, 1999 |
| Party |
Candidate |
Votes | % | ±% | Expenditures |
| |
Progressive Conservative |
Marcel Laurendeau |
4,152 |
46.14 |
+2.24 |
$26,724.22 |
|
New Democratic | Marilyn Brick | 3,483 | 38.69 |
+21.57 |
$10,804.00 |
|
Liberal | Mohinder Dhillon | 1,313 | 14.59 | -25.39 | $17,998.46 |
| Total valid votes |
8,947 |
100.00 |
|
| Rejected and declined votes |
52 |
|
|
| Turnout |
8,999 |
72.96 |
|
| Registered voters |
12,380 |
|
|
[7]
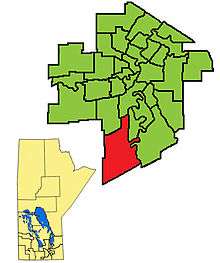
Previous boundaries
The 1999–2011 boundaries for St. Norbert highlighted in red