St. John's West (provincial electoral district)
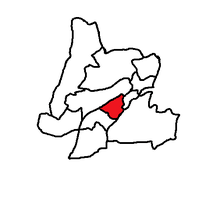 St. John's West in relation to other districts in St. John's | |||
| Provincial electoral district | |||
| Legislature | Newfoundland and Labrador House of Assembly | ||
| MHA |
Liberal | ||
| District created | 1949 | ||
| First contested | 1949 | ||
| Last contested | 2015 | ||
| Demographics | |||
| Population (2006) | 11,805 | ||
| Electors (2011) | 7,741 | ||
St. John’s West is a provincial electoral district for the House of Assembly of Newfoundland and Labrador, Canada. As of 2011, there are 7,741 eligible voters living within the district.[1]
The district is largely residential and middle class and includes the Cowan Heights area. Prior to 1956, the district was larger and elected two MHAs.
Members of the House of Assembly
The district has elected the following Members of the House of Assembly:
| Member | Party | Term | |
|---|---|---|---|
| Siobhán Coady | Liberal | 2015–Present | |
| Dan Crummell | Progressive Conservative | 2011–2015 | |
| Sheila Osborne | Progressive Conservative | 1997-2011 | |
| Rex Gibbons | Liberal | 1989-1997 | |
| Hal Barrett | Progressive Conservative | 1979-1989 | |
| Hubert Kitchen | Liberal | 1977-1979 | |
| John Crosbie | Progressive Conservative | 1966-1977 | |
| William G. Adams | Liberal | 1962-1966 | |
| Joseph R. Smallwood | Liberal | 1959-1962 | |
| Malcolm Hollett | Progressive Conservative | 1952-1959 | |
| Peter Cashin | Progressive Conservative | 1951-1956 | |
| Oliver Vardy | Liberal | 1949-1952 | |
| James Spratt | Liberal | 1949-1951 | |
Election results
| Newfoundland and Labrador general election, 2015 | ||||||||
|---|---|---|---|---|---|---|---|---|
| Party | Candidate | Votes | % | ±% | ||||
| Liberal | Siobhán Coady | 2,342 | 46.00 | +26.75 | ||||
| New Democratic | Earle McCurdy | 1,384 | 27.20 | -10.20 | ||||
| Progressive Conservative | Dan Crummell | 1,364 | 26.80 | -16.65 | ||||
| Newfoundland and Labrador general election, 2011 | ||||||||
|---|---|---|---|---|---|---|---|---|
| Party | Candidate | Votes | % | ±% | ||||
| Progressive Conservative | Dan Crummell | 2,004 | 43.45 | -29.23 | ||||
| New Democratic | Chris Pickard | 1,729 | 37.40 | +30.50 | ||||
| Liberal | George Joyce | 890 | 19.25 | -1.17 | ||||
| Newfoundland and Labrador general election, 2007 | ||||||||
|---|---|---|---|---|---|---|---|---|
| Party | Candidate | Votes | % | ±% | ||||
| Progressive Conservative | Sheila Osborne | 3,623 | 72.68 | -0.47 | ||||
| Liberal | George Joyce | 1,018 | 20.42 | -0.08 | ||||
| New Democratic | Joan Scott | 344 | 6.90 | -0.39 | ||||
| Party | Candidate | Votes | % | ± | |
|---|---|---|---|---|---|
| Progressive Conservative | Sheila Osborne | 4,557 | 72.21 | – | |
| Liberal | Tom Hann | 1,294 | 20.50 | ||
| NDP | Raj Sharan | 460 | 7.29 | ||
| Party | Candidate | Votes | % | ± | |
|---|---|---|---|---|---|
| Progressive Conservative | Sheila Osborne | 3,206 | 49.8 | – | |
| Liberal | Tom Moore | 2,532 | 39.3 | ||
| NDP | Pat Lynch | 683 | 10.6 | ||
| Party | Candidate | Votes | % | ± | |
|---|---|---|---|---|---|
| Liberal | Rex Gibbons | 4,152 | |||
| Progressive Conservative | Bren Kelly | 1,648 | – | – | |
| NDP | Pat Lynch | 651 | |||
| Party | Candidate | Votes | % | ± | |
|---|---|---|---|---|---|
| Liberal | Rex Gibbons | 3,094 | |||
| Progressive Conservative | Paul Sears | 2,485 | – | – | |
| NDP | Bonnie MacGillivray | 835 | |||
| Party | Candidate | Votes | % | ± | |
|---|---|---|---|---|---|
| Liberal | Rex Gibbons | 3,389 | |||
| Progressive Conservative | Hal Barrett | 2,583 | – | – | |
| NDP | Larry Power | 380 | |||
| Party | Candidate | Votes | % | ± | |
|---|---|---|---|---|---|
| Progressive Conservative | Harold Barrett | 3,382 | – | – | |
| Liberal | Gerald Moore | 1,595 | |||
| NDP | Thomas O'Leary | 1,508 | |||
| Party | Candidate | Votes | % | ± | |
|---|---|---|---|---|---|
| Progressive Conservative | Harold Barrett | 2,475 | – | – | |
| Liberal | Ronald Pumphrey | 755 | |||
| NDP | Ronald Lewis | 225 | |||
References
- ↑ "Summary of Polling Divisions ST. JOHN'S WEST" (PDF). 3 August 2011. Retrieved 4 September 2011.
- ↑ CBC news NL votes 2007 district profiles
- ↑ Newfoundland & Labrador Votes 2007. Canadian Broadcasting Corporation. Retrieved May 22, 2009.
- ↑ Newfoundland & Labrador Votes 2003. Canadian Broadcasting Corporation. Retrieved May 22, 2009.
- ↑ General Election Reports Archived 2011-07-06 at the Wayback Machine.. Elections Newfoundland & Labrador.
- 1 2 3 4 5 Report of the Chief Electoral Officer. Retrieved April 13, 2011.
External links
This article is issued from
Wikipedia.
The text is licensed under Creative Commons - Attribution - Sharealike.
Additional terms may apply for the media files.