Ferryland (electoral district)
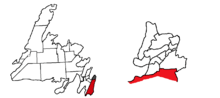 Ferryland in relation to other districts in Newfoundland (left) and St. John's (right). | |||
| Provincial electoral district | |||
| Legislature | Newfoundland and Labrador House of Assembly | ||
| MHA |
Progressive Conservative | ||
| District created | 1975 | ||
| First contested | 1975 | ||
| Last contested | 2015 | ||
| Demographics | |||
| Population (2006) | 11,901 | ||
| Electors (2011) | 8,571 | ||
Ferryland is a provincial electoral district for the House of Assembly of Newfoundland and Labrador, Canada. As of 2011, there are 8,571 eligible voters living within the district.[1]
This was the most strongly anti-Confederation area of the province in the late 1940s, but turned Liberal in the 1950s and 1960s. It is historically a fishing district, but tourism has been growing. Ferryland contains part of the City of St. John's in the area of Lower Goulds as well as the communities of: Admiral's Cove, Aquaforte, Bay Bulls, Bauline East, Biscay Bay, Brigus South, Burnt Cove, Calvert, Cape Broyle, Cappahayden, Daniel's Point, Fermeuse, Ferryland, Kingman's Cove, La Manche, Mobile, Petty-Harbour-Maddox Cove, Port Kirwan, Portugal Cove South, Renews, St. Michael's, St. Shotts, Tors Cove, Trepassey and Witless Bay.
Bordering districts include Conception Bay South, Harbour Main, Mount Pearl-Southlands, Placentia-St. Mary's and Waterford Valley.
Members of the House of Assembly
The district has elected the following Members of the House of Assembly:
| Member | Party | Term | |
|---|---|---|---|
| Keith Hutchings | Progressive Conservative | 2007- | |
| Loyola Sullivan | Progressive Conservative | 1992-2006 | |
| Charlie Power | Progressive Conservative | 1975-1992 | |
| Thomas Doyle | Progressive Conservative | 1971-1975 | |
| Aidan Maloney | Liberal | 1966-1971 | |
| Myles Murray | Liberal | 1956-1966 | |
| Augustine Duffy | Progressive Conservative | 1951-1956 | |
| Peter Cashin | Independent | 1949-1951 | |
Election results
| Newfoundland and Labrador general election, 2015 | ||||||||
|---|---|---|---|---|---|---|---|---|
| Party | Candidate | Votes | % | |||||
| Progressive Conservative | Keith Hutchings | 3,093 | 49.83 | |||||
| Liberal | Jeff Marshall | 2,550 | 41.08 | |||||
| New Democratic | Mona Rossiter | 564 | 9.09 | |||||
| Total valid votes | 6,207 | 100.00 | ||||||
| Party | Candidate | Votes | % | ± | |
|---|---|---|---|---|---|
| Progressive Conservative | Keith Hutchings | 3,640 | 72.15 | -11.65 | |
| NDP | Chris Molloy | 1.224 | 24.26 | +17.35 | |
| Liberal | Dianne Randell | 181 | 3.59 | -5.7 | |
| Party | Candidate | Votes | % | ± | |
|---|---|---|---|---|---|
| Progressive Conservative | Keith Hutchings | 4,256 | 83.8% | +8.7% | |
| Liberal | Kevin Bennett | 472 | 9.29% | -10.9% | |
| NDP | Grace Bavington | 351 | 6.91% | +1.95% | |
| Party | Candidate | Votes | % | ± | |
|---|---|---|---|---|---|
| Progressive Conservative | Keith Hutchings | 2,770 | 75.10% | -11.24% | |
| Liberal | Kevin Bennett | 715 | 19.38% | +10.97% | |
| NDP | Rick Boland | 183 | 4.96% | -0.19% | |
| Party | Candidate | Votes | % | ± | |
|---|---|---|---|---|---|
| Progressive Conservative | Loyola Sullivan | 5,167 | 86.34 | – | |
| Liberal | Andrea Kavanagh | 504 | 8.41 | ||
| NDP | Lois Martin | 309 | 5.15 | ||
| Independent | Pilar Riego-Hickey | 11 | 0.18 | ||
| Party | Candidate | Votes | % | ± | |
|---|---|---|---|---|---|
| Progressive Conservative | Loyola Sullivan | 4,482 | 66.0% | – | |
| Liberal | Harold Mulloney | 2,141 | 31.5% | ||
| NDP | Gerry Ryan | 147 | 2.2% | ||
| Party | Candidate | Votes | % | ± | |
|---|---|---|---|---|---|
| Progressive Conservative | L Sullivan | 4834 | 68.36% | – | |
| Liberal | T Best | 2237 | 31.63% | ||
| Party | Candidate | Votes | % | ± | |
|---|---|---|---|---|---|
| Progressive Conservative | L Sullivan | 3675 | 74.00% | – | |
| Liberal | MC O'Brien | 1125 | 22.65% | ||
| NDP | V Silk | 166 | 0.32% | ||
References
- ↑ "Summary of Polling Divisions FERRYLAND" (PDF). Elections Newfoundland and Labrador. 3 August 2011. Retrieved 14 September 2011.
- ↑ Encyclopedia of Newfoundland and Labrador
- ↑ Newfoundland & Labrador Votes 2007. Canadian Broadcasting Corporation. Retrieved May 22, 2009.
- ↑ Ferryland byelection February 8, 2007 Archived July 6, 2011, at the Wayback Machine.
- ↑ Newfoundland & Labrador Votes 1996 Archived 2011-08-07 at the Wayback Machine.. Elections Newfoundland and Labrador. Retrieved 2011-04-03.
- ↑ Newfoundland & Labrador Votes 1993 Archived 2011-07-06 at the Wayback Machine.. Elections Newfoundland and Labrador. Retrieved 2011-04-03.