Soil texture
Soil texture is a classification instrument used both in the field and laboratory to determine soil classes based on their physical texture. Soil texture can be determined using qualitative methods such as texture by feel, and quantitative methods such as the hydrometer method. Soil texture has agricultural applications such as determining crop suitability and to predict the response of the soil to environmental and management conditions such as drought or calcium (lime) requirements. Soil texture focuses on the particles that are less than two millimeters in diameter which include sand, silt, and clay. The USDA soil taxonomy and WRB soil classification systems use 12 textural classes whereas the UK-ADAS system uses 11.[1] These classifications are based on the percentages of sand, silt, and clay in the soil.
Soil texture classification
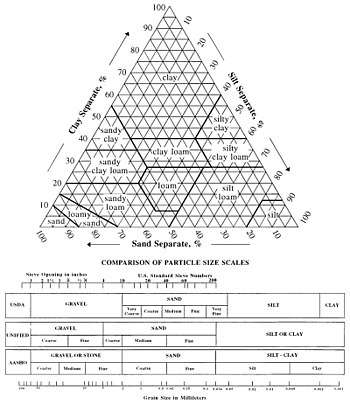
In the United States, twelve major soil texture classifications are defined by the USDA.[1] The twelve classifications are sand, loamy sand, sandy loam, loam, silt loam, silt, sandy clay loam, clay loam, silty clay loam, sandy clay, silty clay, and clay.[2] Soil textures are classified by the fractions of each soil separate (sand, silt, and clay) present in a soil. Classifications are typically named for the primary constituent particle size or a combination of the most abundant particles sizes, e.g. "sandy clay" or "silty clay". A fourth term, loam, is used to describe equal properties of sand, silt, and clay in a soil sample, and lends to the naming of even more classifications, e.g. "clay loam" or "silt loam".
Determining soil texture is often aided with the use of a soil texture triangle.[2] An example of a soil triangle is found on the right side of the page. One side of the triangle represents percent sand, the second side represents percent clay, and the third side represents percent silt. If you know the percentages of sand, clay, and silt in your soil sample, the triangle can be used to determine which of the twelve soil types you have. To do this, find your percentage of sand along the bottom of the triangle. Then follow the slanted line up to the left until you reach your percentage of clay. Where that point is will tell you what soil type you have. For example, if your soil is 70 percent sand and 10 percent clay then your soil is classified as a sandy loam. The same method can be used starting on any side of the soil triangle. If the texture by feel method was used to determine which type of soil you had, the triangle can also provide a rough estimate on the percentages of sand, silt, and clay in your soil.
Chemical and physical properties of a soil are related to texture. Particle size and distribution will affect a soil's capacity for holding water and nutrients. Fine textured soils generally have a higher capacity for water retention, whereas sandy soils contain large pore spaces that allow leaching.[3]
Soil separates

Soil separates are specific ranges of particle sizes. The smallest particles are clay particles and are classified as having diameters of less than 0.002 mm. Clay particles are plate-shaped instead of spherical, allowing for an increased specific surface area.[4] The next smallest particles are silt particles and have diameters between 0.002 mm and 0.05 mm (in USDA soil taxonomy). The largest particles are sand particles and are larger than 0.05 mm in diameter. Furthermore, large sand particles can be described as coarse, intermediate as medium, and the smaller as fine. Other countries have their own particle size classifications.
| Name of soil separate | Diameter limits (mm) (USDA classification) | Diameter limits (mm) (WRB classification) |
|---|---|---|
| Clay | less than 0.002 | less than 0.002 |
| Silt | 0.002 - 0.05 | 0.002 - 0.063 |
| Very fine sand | 0.05 - 0.10 | 0.063 - 0.125 |
| Fine sand | 0.10 - 0.25 | 0.125 - 0.20 |
| Medium sand | 0.25 - 0.50 | 0.20 - 0.63 |
| Coarse sand | 0.50 - 1.00 | 0.63 - 1.25 |
| Very coarse sand | 1.00 - 2.00 | 1.25 - 2.00 |
Methods to Determine Soil Texture
Texture by feel

Hand analysis is a simple and effective means to rapidly assess and classify a soil's physical condition. Correctly executed, the procedure allows for rapid and frequent assessment of soil characteristics with little or no equipment. It is thus an extremely useful tool for identifying spatial variation both within and between fields as well as identifying progressive changes and boundaries between soil map units (soil series). Texture by feel is a qualitative method, it does not provide exact values of sand, silt, and clay. Although qualitative, the texture by feel flowchart can be an accurate way for a scientist or interested individual to analyze the relative proportions of sand, silt, and clay.[5]
The texture by feel method involves taking a small sample of soil and making a ribbon. A ribbon can be made by taking a ball of soil and pushing the soil between your thumb and forefinger, squeezing it upward into a ribbon. Allow the ribbon to emerge and extend over the forefinger, breaking from its own weight. Measuring the length of the ribbon can help determine the amount of clay in the sample. After making a ribbon, excessively wet a small pinch of soil in the palm of your hand and rub in with your forefinger to determine the amount of sand in the sample. Soils that have a high percentage of sand, such as sandy loam, or sandy clay, have a gritty texture.[1] Soils that have a high percentage of silt, such as silty loam or silty clay, feel smooth.[1] Soils that have a high percentage of clay, such as clay loam, have a sticky feel. Although the texture by feel method takes practice, it is a useful way to determine soil texture, especially in the field.
Hydrometer Method
The hydrometer method of determining soil texture is a qualitative measurement providing estimates of the percent sand, clay, and silt in the soil.[6] The hydrometer method was developed in 1927[7] and is still widely used today. This method requires a chemical compound, sodium hexametaphsophate, which acts as a dispersing agent to separate soil aggregates. The soil is mixed with the sodium hexametaphosphate solution on an orbital shaker overnight. The solution is transferred to one liter graduated cylinders and filled with water. The soil solution is mixed with a metal plunger to disperse the soil particles.[6] The soil particles separate based on size and sink to the bottom. Sand particles are the largest (2.00 - 0.05 mm) and sink to the bottom of the cylinder first. Silt particles are the medium-sized (0.05 - 0.002 mm) and sink to the bottom of the cylinder after the sand. Clay particles are the smallest (<0.002 mm) and separate out above the silt layer. Measurements are taken using a soil hydrometer. A soil hydrometer measures that relative density of liquids (density of a liquid to the density of water). The hydrometer is lowered into the cylinder containing the soil mixture at different times, forty-five seconds to measure sand content, one and a half hours to measure silt content and between six and twenty-four hours (depending on the protocol used) to measure clay. The number on the hydrometer that is visible (above the soil solution) is recorded.[6] A blank (containing only water and the dispersing agent) is used to calibrate the hydrometer.
The values recorded from the readings are used to calculate the percent clay, silt and sand. The blank is subtracted from each of the three readings. The calculations are as follows:[6]
Percent silt = ( dried mass of soil - (sand hydrometer reading - blank reading) / (dried mass of soil) *100
Percent clay = (clay hydrometer reading - blank reading) / (dried mass of soil) *100
Percent sand = 100 - (percent clay + percent silt)
Additional Methods
There are several additional quantitative methods to determine soil texture. Some examples of these methods are the pipette method, the particulate organic matter (POM) method, and the rapid method[8]
History of classification
The first classification, the International system, was first proposed by Albert Atterberg (1905), and was based on his studies in southern Sweden. Atterberg chose 20 μm for the upper limit of silt fraction because particles smaller than that size were not visible to the naked eye, the suspension could be coagulated by salts, capillary rise within 24 hours was most rapid in this fraction, and the pores between compacted particles were so small as to prevent the entry of root hairs.[9] Commission One of the International Society of Soil Science (ISSS) recommended its use at the first International Congress of Soil Science in Washington in 1927.[10] Australia adopted this system and according to Marshall (1947) its equal logarithmic intervals are an attractive feature worth maintaining.[11] The USDA adopted its own system in 1938, and the FAO used the USDA system in the FAO-UNESCO world soil map and recommended its use.
See also
References
- 1 2 3 4 Soil Science Division Staff. 2017. Soil survey manual. C. Ditzler, K. Scheffe, and H.C. Monger (eds.). USDA Handbook 18. Government Printing Office, Washington, D.C.
- 1 2 Soil Survey Division Staff (1993). Soil survey manual. United States Department of Agriculture. pp. 63–65. Retrieved 30 August 2014.
- ↑ Lindbo, Hayes, Adewunmi (2012). Know Soil Know Life: Physical Properties of Soil and Soil Formation. Soil Science Society of America. p. 17. ISBN 9780891189541.
- ↑ Foth, Henry D. (1990). Fundamentals of Soil Science 8th Edition. Canada: John Wiley & Sons. p. 23. ISBN 0-471-52279-1.
- ↑ Thien, Steven. "Determining Soil Texture by the "Feel Method"" (PDF). NDHealth.gov.
- 1 2 3 4 Bouyoucos, George. 1936. Directions for making mechanical analysis of soils by the hydrometer method. Soil Science. Vol 42 Issue 3: pp 225-230
- ↑ Bouyoucos G. 1951. A recalibration of the hydrometer method for making mechanical analysis of soils. American Society of Agronomy.
- ↑ Kettler, T., Doran, J., Gilbert, T., 2001. Simplified method for soil particle-size determination to accompany soil-quality analyses. Soil Sci. Soc. Am. J. 65:849-853
- ↑ Atterberg A (1905) Die rationalle Klassifikation der Sande und Kiese. Chemiker Zeitung 29, 195-198.
- ↑ Davis ROE, Bennett HH (1927) "Grouping of soils on the basis of mechanical analysis." United States Department of Agriculture Departmental Circulation No. 419.
- ↑ Marshall TJ (1947) "Mechanical composition of soil in relation to field descriptions of texture." Council for Scientific and Industrial Research, Bulletin No. 224, Melbourne.
Additional Information
- Natural Resources Conservation Service. (n.d.). Retrieved November 29, 2017, from https://www.nrcs.usda.gov/wps/portal/nrcs/detail/soils/edu/?cid=nrcs142p2_054311
- Prescott JA, Taylor JK, Marshall TJ (1934) "The relationship between the mechanical composition of the soil and the estimate of texture in the field." Transactions of the First Commission of the International Society of Soil Science 1, 143–153.
- Rowell D (1994) Soil Science; Methods and Application, Longman Scientific & Technical (1994), 350 pages
- Soil Texture, by R. B. Brown, University of Florida, Institute of Food and Agricultural Sciences.
- Toogood JA (1958) "A simplified textural classification diagram." Canadian Journal of Soil Science 38, 54–55.
- Whitney M (1911) "The use of soils east of the Great Plains region." United States Department of Agriculture Bureau of Soils Bulletin No. 78.
