Sectoral balances
The sectoral balances (also called sectoral financial balances) are a sectoral analysis framework for macroeconomic analysis of national economies developed by British economist Wynne Godley.[1]
The balances represent an accounting identity resulting from rearranging the components of aggregate demand, showing how the flow of funds affects the financial balances of the private sector, government sector and foreign sector.[4] This corresponds approximately to Balances Mechanics developed by Wolfgang Stützel in the 1950s.
The approach is used by scholars at the Levy Economics Institute to support macroeconomic modelling and by Modern Monetary Theorists to illustrate the relationship between government budget deficits and private saving.[4]
Overview

The government fiscal balance is one of three major financial sectoral balances in the national economy, the others being the foreign financial sector and the private financial sector. The sum of the surpluses or deficits across these three sectors must be zero by definition. A surplus balance represents a net savings or net financial asset building position, while a deficit balance represents a net borrowing or net financial asset reducing position. Each sector may be defined as follows, using the U.S. as an example:
- Private sector: A surplus balance means U.S. households and businesses together are net savers, building their financial asset position. In other words, savings by households exceed the amount borrowed and invested by businesses. The private sector had a roughly 1.2% GDP surplus in 2017. A deficit would mean households and businesses together are net borrowers, reducing their financial asset position.
- Foreign sector or "rest of the world": A surplus balance means those outside the U.S. are net savers. This is consistent with a U.S. trade deficit, in which U.S. residents borrow savings from foreign residents to finance import purchases. Foreigners are building their net financial asset position by lending to the U.S. so it can purchase their imports. The U.S. had a trade deficit of roughly 2.3% GDP in 2017. A foreign sector deficit balance would mean foreign residents are net spenders and are borrowing from the U.S. private sector, which would be consistent with a U.S. trade surplus; this was not the 2017 situation.
- Government balance (all levels, e.g., federal, state and local in the U.S.): A surplus balance represents a government collecting more tax revenue than it pays in outlays, building its net financial asset position. This would mean the government is a net saver, removing funds from the private sector. A deficit balance means government outlays are greater than tax revenue and it is reducing its net financial asset position (i.e., increasing its debt position), providing funds to the private sector. Another interpretation is that a government surplus reduces private sector financial assets, while a government deficit increases private sector financial assets. The U.S. government at all levels ran a 3.5% GDP deficit in 2017.[2]
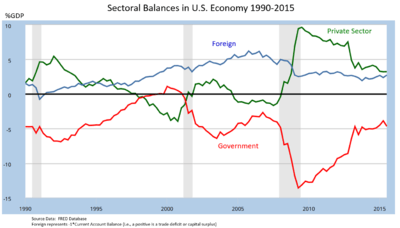
To summarize, in the U.S. in 2017, there was a private sector surplus of 1.2% GDP due to household savings exceeding business investment. There was also a trade deficit of 2.3% GDP, meaning the foreign sector was in surplus. By definition, there must therefore exist a government budget deficit of 3.5% GDP so all three net to zero. This is a relatively balanced position, but such is not always the case. For example, the U.S. government budget deficit in 2011 was approximately 10% GDP (8.6% GDP of which was federal), offsetting a foreign sector surplus of 4% GDP and a private sector surplus of 6% GDP.[6]
Expressed as a formula, the sectoral balance identity is: (Savings - Investment) + (Imports - Exports) + (Tax Revenues - Outlays) = 0; or (S-I) + (M-X) + (T-G) =0, as described below.
Recent interpretations
Economist Wynne Godley explained in 2004-2005 how U.S. sector imbalances posed a significant risk to the U.S. and global economy. The combination of a high and growing foreign sector surplus and high government sector deficit meant that the private sector was moving towards a net borrowing position (from surplus to deficit) as a housing bubble developed, which he warned was an unsustainable combination.[7][8]
Economist Martin Wolf cites as an example the U.S., where sudden shifts in the private sector from deficit to surplus due to the Great Recession forced the government balance into deficit.[6] "The financial balance of the private sector shifted towards surplus by the almost unbelievable cumulative total of 11.2 per cent of gross domestic product between the third quarter of 2007 and the second quarter of 2009, which was when the financial deficit of US government (federal and state) reached its peak...No fiscal policy changes explain the collapse into massive fiscal deficit between 2007 and 2009, because there was none of any importance. The collapse is explained by the massive shift of the private sector from financial deficit into surplus or, in other words, from boom to bust."[6]
Economist Paul Krugman also explained in December 2011 the causes of the sizable shift from private deficit to surplus: "This huge move into surplus reflects the end of the housing bubble, a sharp rise in household saving, and a slump in business investment due to lack of customers."[9]
Economists at the New Policy Institute explained in 2011 that: "In a healthy economy, businesses invest using money borrowed from households who are saving for future consumption. In the ideal world, this business sector deficit and household sector surplus are accompanied by net exports (a deficit for the rest of the world) and a small government deficit (to fund its own investment)."[2]
Sectoral balances description
GDP (Gross Domestic Product) is the value of all goods and services sold within a country during one year. GDP measures flows rather than stocks (example: the public deficit is a flow, the government debt is a stock). Flows are derived from the National Accounting relationship between aggregate spending and income. Ergo:
(1) Y = C + I + G + (X – M)
where Y is GDP (expenditure), C is consumption spending, I is private investment spending, G is government spending, X is exports and M is imports (so X – M = net exports).
Another perspective on the national income accounting is to note that households can use total income (Y) for the following uses:
(2) Y = C + S + T
where S is total saving and T is total taxation (the other variables are as previously defined).
You then bring the two perspectives together (because they are both just “views” of Y) to write:
(3) C + S + T = Y = C + I + G + (X – M)
You can then drop the C (common on both sides) and you get:
(4) S + T = I + G + (X – M)
Then you can convert this into the following sectoral balances accounting relations, which allow us to understand the influence of fiscal policy over private sector indebtedness. Hence, equation (4) can be rearranged to get the accounting identity for the three sectoral balances – private domestic, government budget and external:
- (S – I) = (G – T) + (X – M) or
- (S - I) + (M - X) + (T - G) = 0
The sectoral balances equation says that total private savings (S) minus private investment (I) has to equal the public deficit (spending, G minus taxes, T) plus net exports (exports (X) minus imports (M)), where net exports represent the net savings of non-residents.
Another way of saying this is that total private savings (S) is equal to private investment (I) plus the public deficit (spending, G minus taxes, T) plus net exports (exports (X) minus imports (M)), where net exports represent the net savings of non-residents.
All these relationships (equations) hold as a matter of accounting and not matters of opinion.
Thus, when an external deficit (X – M < 0) and public surplus (G - T < 0) coincide, there must be a private deficit. While private spending can persist for a time under these conditions using the net savings of the external sector, the private sector becomes increasingly indebted in the process.
Usage
In macroeconomics, the Modern Money Theory uses sectoral balances to define any transactions between the government sector and the non-government sector as a vertical transaction.
The government sector is considered to include the treasury and the central bank, whereas the non-government sector includes private individuals and firms (including the private banking system) and the external sector – that is, foreign buyers and sellers.[10]
In any given time period, the government’s budget can be either in deficit or in surplus. A deficit occurs when the government spends more than it taxes; and a surplus occurs when a government taxes more than it spends. Sectoral balances analysis states that as a matter of accounting, it follows that government budget deficits add net financial assets to the private sector. This is because a budget deficit means that a government has deposited more money into private bank accounts than it has removed in taxes. A budget surplus means the opposite: in total, the government has removed more money from private bank accounts via taxes than it has put back in via spending.
Therefore, budget deficits, by definition, are equivalent to adding net financial assets to the private sector; whereas budget surpluses remove financial assets from the private sector.
This is represented by the identity:
(G – T) = (S – I) – NX
which is
(State sector balance) = (Private sector balance) – External sector balance
where G is government spending, T is taxes, S is savings, I is investment and NX is net exports.
The conclusion drawn from this is that private net saving is only possible when running a trade deficit if the government runs budget deficits; alternately, the private sector is forced to dis-save when the government runs a budget surplus and the trade deficit exists.
According to the sectoral balances framework, budget surpluses remove net savings; in a time of high effective demand, this may lead to a private sector reliance on credit to finance consumption patterns. Hence, continual budget deficits are necessary for a growing economy that wants to avoid deflation. Therefore, budget surpluses are required only when the economy has excessive aggregate demand, and is in danger of inflation.
Austerity in the view of the sectoral balances approach
According to the sectoral balances approach, austerity can be counterproductive in a downturn due to a significant private-sector financial surplus, in which consumer savings is greater than business investment. In a healthy economy, the amount borrowed or invested by companies is greater than or equal to the private-sector savings placed into the banking system by consumers. However, if consumers have increased their savings but companies are not investing, a surplus develops in the banking system. Business investment is one of the major components of GDP.
Economist Richard Koo described similar effects for several of the developed world economies in December 2011: "Today private sectors in the U.S., the U.K., Spain, and Ireland (but not Greece) are undergoing massive deleveraging [paying down debt rather than spending] in spite of record low interest rates. This means these countries are all in serious balance sheet recessions. The private sectors in Japan and Germany are not borrowing, either. With borrowers disappearing and banks reluctant to lend, it is no wonder that, after nearly three years of record low interest rates and massive liquidity injections, industrial economies are still doing so poorly. Flow of funds data for the U.S. show a massive shift away from borrowing to savings by the private sector since the housing bubble burst in 2007. The shift for the private sector as a whole represents over 9 percent of U.S. GDP at a time of zero interest rates. Moreover, this increase in private sector savings exceeds the increase in government borrowings (5.8 percent of GDP), which suggests that the government is not doing enough to offset private sector deleveraging."[11]
See also
References
- ↑ Goldman's Top Economist Explains The World's Most Important Chart, And His Big Call For The US Economy
- 1 2 3 4 New Policy Institute-United States Sectoral Balances over Five Decades-July 29, 2011
- ↑ FRED-Sectoral Balances-Three Line Annual Version-Retrieved June 28, 2018
- 1 2 Fiebeger, Brett (2013). "A constructive critique of the Levy Sectoral Financial Balance approach". Real World Economics Review: 59–80.
- ↑ FRED-Sectoral Balances Household and Business (Private Sector Detail)-Retrieved June 29, 2018
- 1 2 3 Financial Times-Martin Wolf-The Balance Sheet Recession in the U.S.- July 2012
- ↑ Levy Economics Institute-Wynne Godley-Imbalances Looking for a Policy-April 2005
- ↑ Levy Economics Institute-Wynne Godley-Some Unpleasant American Arithmetic-June 2005
- ↑ NYT-Paul Krugman-The Problem-December 2011
- ↑ "Deficit Spending 101 - Part 1 : Vertical Transactions" Bill Mitchell, 21 February 2009
- ↑ Richard Koo-The world in balance sheet recession-Real World Economics Review-December 2011
Further reading
- Sloman, John (1999). Economics, 3rd edition. Prentice Economics. Europe: Prentice-Hall. ISBN 0-273-65574-4.
- Mankiw, Gregory (2006). Principles of Economics. Thomson Europe. ISBN 1-84480-133-0.