Scholar Indices and Impact
Scholar indices are used to measure the contributions of scholars to their fields of research. Since the 2005 paper of Jorge E. Hirsch,[1] the use of scholar indices has increased.
Definition
Sometimes called bibliometrics, scholar indices are mathematical and statistical tools that measure the significance of the contributions made by an academic to their field of research. Scholar indices may incorporate other assessments such as citation tracking and journal ranking.
Creation
Any aggregator of citations and references, could, given time, money and inclination, generate their own set of scholar indices. Publishers who are prominent in this field include Elsevier and Thomson Reuters.
Commercial software which use parsers and web search engines to generate sets of scholar indices or individual results are now available. Examples are: Publish or Perish;[2] 'ScholarIndex';[3] 'Scopus'[4] and 'Google Scholar'.[5]
Each software vendor primarily uses its own data as well as journals, publications, authority files, indexes, and subject categories to produce sets of scholar indices.
While some companies provide the data and the evaluated metrics as free downloads, others require subscriptions to cover costs of manufacture and upkeep of an efficient parser, search engine and document database.
Use
Scholar indices allow choice of journal collections, application of research funds, ranking of journals and the determination of significant contributors in a subject area.[6] [7]
Advocates of scholar indices recommend their use in areas such as liaison services, references, instruction and collection management.[8]
Critics of the use of scholar indices cite their limitations due to issues of accuracy, validity and applicability and debate their application to hiring, tenure, funding, award giving and membership decisions.
Although scholar indices may not completely describe the impact of an individual researcher's work, some academics will determine their own scholar indices to include in promotional material and curriculum vita for example. Others may study their scholar indices simply for their own sake.
Those interested in the field of scholar indices may find the results, for example data visualisation projects, exciting.
Types
To date, a number of scholar indices have been developed. One is the 'h-index' introduced by Jorge E. Hirsch in August 2005. Hirsch described the h-index as unbiased as it involved the relationship of an academic's volume of published papers and the number of citations for those papers creating less bias than either measure alone.
Another scholar index is the 'g-index' which measures citation counts of all well cited works over a period of time. The 'm-quotient' was developed to introduce a time limit to the h-index which was otherwise, an ever-increasing quantity.
Other variants of the h-index such as hI-index, e-index [9] and others are being developed and reviewed.
The Erdős number [10] was developed to measure the publication chain started by Paul Erdős.
All such scholar indices quantify the contribution of a researcher based on citations of their work only. Ideally, an assessment of a researcher's contribution to their field would include both scholar indices and an analysis of the quality of the work itself.
h-index
The h-index index was suggested by Jorge E. Hirsch, a physicist at UCSD, in 2005.[1]
Henry Schaefer, of the University of Georgia, US, together with colleague Amy Peterson, created rankings according to the h-index, from the ISI Web of Science. Though web-based applications can calculate h-indices, Peterson had to check for misspelt or duplicated names.
The h-index is defined as follows:
- A scientist has index h if h of his or her N papers have at least h citations each, and the other (N-h) papers have no more than h citations each.
To calculate the h-index, the papers written by an academic are arranged in decreasing order of number of citations. The h index is where the number of papers equals the number of citations (beginning with the paper with the highest number of citations).
Although widely used, the h index does not take into account the quality of the papers; other papers which cite the academics publications; the number of co-authors and the position of the author in the author list. Also, all fields are given equal value.
Another limitation is that the h index does not vary over time. For example, Évariste Galois has an h index of 2 while Claude Shannon has an h index of 7 [11]
m-quotient
While the h-index is independent of the date of an academic's career, the m-quotient aims at weighing the period of academic endeavour so that even junior scientists attain the importance that they deserve.
Thus, if n=number of years since the first published paper of the scientist, the m-quotient=h-index/n.
However, the m-quotient may not stabilise until later in the scientist's career. for researchers in the early part of their career, who have low h indices, small changes in the h-index can lead to large changes in the m-quotient. Hirsch suggests the researcher's first published paper may not always be the appropriate starting point, especially if it was a minor contribution that was published well before the academic's period of sustained productivity.
Although the m-quotient adds time as a weighting factor, it does not cater to the major disadvantages of the h-index including quality of publication and quality of citation.
g-index
g-index is a variant of the h-index, which takes into account the citation evolution of the most cited papers over time.
- A set of papers has a g-index g if g is the highest rank such that the top g papers have, together, at least g^2 citations.
In other words, the g-index g is the largest rank (where papers are arranged in decreasing order of the number of citations they received) such that the first g papers have (together) at least g^2 citations.
It can be proved that for any set of papers g-index always exists and is unique.[12]

where the Lotkaian exponent and where T denotes the total number of sources.
Since ,


For example, if 2 scientists have h-index 4, it may happen that one of them has published 4 papers which have 4 or more citations, while another scientist may have published 10 papers out of which 3 have more than 100 citations and the 4th paper has 4 citations, and the remaining have less than 4 citations.
In an attempt to offer a higher weighting to the second scientist who in aggregation has received greater than 304 citations for 10 papers, the g-index was proposed. Thus in our example, the first scientist has g-index=4, while the second scientist has g-index significantly higher.
Erdős Number
An Erdős number measures the collaborative distance between a person and mathematician Paul Erdős, measured by authorship of mathematical papers.
Considering Paul Erdős to have an index=0, people who co-authored with him have an index=1, co authors of those co-authors have index=2, and so on. Thus, to calculate one’s Erdős number, add 1 to the Erdős number of any co-author with the lowest Erdős, number. The Erdős-Number project at Oakland University maintains a website tracking the Erdős numbers of scientists world-wide.
One caveat is that most Erdős numbers recorded so far range up to 13, but the average is less than 5, and almost everyone with a finite Erdős number has a number less than 8.
Hubs and Authority indices
Evaluation of the complete contribution of a scholar to their field of research can be assessed in two ways. One is by accounting for the number of citations received by the scholar. The other is by accounting for the quality of the references referred to by the scholar.
While being strongly cited makes a scholar a strong authority in his field, having strong references makes a scholar a strong hub, who knows all the significant work in that field. Calculation of the hub and authority indices requires the knowledge of the relationships between scholars being cited or referred to.
The Hubs and Authorities algorithm can be used for computing these indices. The algorithm performs a link analysis on a given network and assigns two scores to each node: a hub and an authority.;[13][14]
A valuable and informative node in a network is usually pointed to by a large number of links, that is, it has a large indegree (see Fig. 1). Such a node is called an authority.[15]
A node that points to many authority nodes is itself a useful resource and is called a hub. A hub usually has a large outdegree. In the context of literature citation, a hub is a review paper which cites many original papers, while an authority is an original seminal paper which is cited by many papers.[16]
A network can be constructed of nodes representing authors and links indicating references to published papers. Outgoing links indicate who the author cited and incoming links indicate who cited the author.
A researcher's hub score is the sum of authors' scores whose work is cited. A researcher's authority score is the sum of authors' hub scores who referenced the researcher's work.
The hub score increases if the author cites papers published by authors with high authority scores. The authority score increases when published papers are cited by authors with high hubs score.


The equations can be rewritten in a matrix-vector form. Let A be an adjacency matrix of the network and vectors h and a to contain all hubs and authorities scores, respectively. Then the scores can be calculated by the following formulas.[17]


Hubs and authority index algorithm implementation
Hubs and authorities indices require the knowledge of the connectivity between scholars who refer and cite each other’s work. Since it is not always possible to accurately obtain these connectivity patterns, the adjacency matrix (A) regarding the scholar’s connections can be estimated.
For example, a scientist has an estimated local connectivity matrix. It is a combination of the work by which he is cited and works which he cites. Once the adjacency network is estimated, the hub and authority indices are determined by eigen-decomposition of (A.A’) and (A’.A) respectively. The steps followed for this specific implementation are as follows:
- Step 1: Let the scholar to be evaluated be S. This scholar is searched in Scopus and the total number of citations he has received= c, and the total number of references he has used=r.
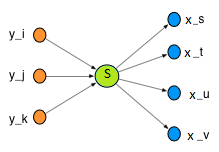
- Step 2: A list of scholars who have cited the works of S are recorded as a set Y. The list of scholars who have been referred by S are recorded as X. The choice of members of X and Y are made in the order of decreasing citations in Scopus. Since an estimate of adjacency matrix A was sufficient, thus, we recorded members of X, and Y with citations greater than 100 in Scopus. Let the number of significant citations = cs , and the number of significant references = rs . For each significant member of X and Y, one evaluates the ratio of (the number of citations/number of references) as weights of matrix A.
- Step 3: Once the weights corresponding to the significant members of X and Y are calculated, the weights of not-so-significant members are estimated randomly. Thus, random weights are generated for c − cs citations for members of Y and r − rs references for members of X. The matrix A is thus generated as:
| A | Column | S | X | Y |
|---|---|---|---|---|
| Row index | S | 0 | 1 | 0 |
| X | 0 | 0 | 0 | |
| Y | 1 | 0 | 0 |
Where blocks of X and blocks of Y replace the ‘1’s. The connectivity follows the Fig 2.

- Step 4: The initial hub vector is calculated as primary eigen-vector (with the highest eigen-value) of A.A’ and normalized between [0,1]. The initial authority vector is the primary eigen-vector of A’.A and normalized too. Since these indices are interrelated, thus, the hub vector becomes A*initial authority vector, and the authority vector becomes A’*initial hub vector. Since the scientist ‘S’ was the first entry of matrix A, hence the first value of the hub and authority vectors are the hub-authority indices for scientist S. The pseudocode for the same is as follows is S is a scholar whose hub index is h and authority index is a.
Pseudo code
1

2

3

4

Example 1: Scholar indices of well-known scientists
| Scientist | h-index (using Publish or Perish) [2] | g-index (using Publish or Perish)[2] | h-index (using Scopus)[4] | Hub index (per 10^2)[4] | Authority Index [4] |
|---|---|---|---|---|---|
| Newman, MEJ | 65 | 210 | 51 | 210.54 | 129.3687 |
| Einstein, Albert | 92 | 231 | N/A (nothing submitted after 1995) | 0 | 99.9586 |
| Shannon, CE | 44 | 228 | N/A (nothing submitted after 1995) | 0 | 15.9117 |
| Erdős, Paul | 76 | 142 | 8 | 0.406490 | 77.8040 |
| Shenker, Scott | 105 | 253 | 36 | 29.173 | 171.1167 |
| Hirsch, Jorge E. | 31 | 70 | 21 | 78.938 | 151.5361 |
| Pople, John | 87 | 293 | 29 | 123.7993 | 355.6553 |
The table utilizes Scopus as a search engine only and the adjacency matrix is an estimation, thus the results tabulated above are extremely aggregated versions, and they must not be confused with absolute indices. A better estimate of adjacency matrix may produce variations in the indices. Also, Scopus keeps track of articles after 1995 only, so that is an additional constraint. (All the indices have been evaluated as of December 12, 2011.)
In this table, it is evident that different search engines yield different h-indices. It is possible that a scientist with high h-index may be a strong authority but not necessarily a strong hub. The validity of web-search engines is assessed as documents prior to 1995 are inaccessible. The number of publications of a particular author in a particular data base is responsible for affecting the hub-authority indices. Interdisciplinary work may be well assessed by the hub-authority index as opposed to other indices.
Example 2: Projected hub-authority indices with time (Toy example)
This is an example to understand the interplay of the various scholar indices.
A new scientist who began her academic career in 2009, has published 3 papers. Two papers have 2 citations each while the third paper has no citations. She has referenced 60 papers with 17 strong references among the 60. One of her co-authors has the lowest Erdős number 3. Her scholar indices as per December 2011 are:
- h-index= 2
- g-index=2
- m-quotient= 2/2=1
- Erdős number=3+1=4
- HUB index (per 10^2)= 11.702
- AUTHORITY index= 0.1061
In another year, she publishes another paper with 20 new references such that now she has a cumulative of 31 strong references, 4 papers with 2 citations for 2 papers and 0 citations for other 2 papers. Her hub-authority indices change:
HUB index=12.668
AUTHORITY index= 0.1061
In another year, her citations for the 3 papers increases to 10 and she continues to have 60 references with 17 strong references:
HUB index=11.568
AUTHORITY index=0.3241
In another year, her citations increase to 10 and she writes another paper such that the number of references goes up to 80 (with 31 strong ones):
HUB index=12.694
AUTHORITY index=0.3284
Thus to summarize, the following hub-authority indices are observed for this toy example.
| Instance | No. of citations | No. of references | HUB (per 10^2) | AUTHORITY |
|---|---|---|---|---|
| Currently | 4 | 60 | 11.702 | 0.1061 |
| If references increase | 4 | 80 | 12.668 | 0.1061 |
| If citations increase | 10 | 60 | 11.568 | 0.3241 |
| If citations and references increase | 10 | 80 | 12.694 | 0.3284 |
The matlab code for the Example 1 and Toy example instances in Example 2 is attached as File 1.
These examples demonstrate the importance of the hub-authority indices in quantitative evaluation of the contributions of a scholar in a complete academic career.
Criticism
Scholar indices have limitations including lack of accuracy, validity and applicability. While the accuracy of scholar indices is questionable owing to the difference in spellings, difference in parser, search engines and document data bases maintained by various online sources, it might be possible to solve the accuracy issues if each author could be assigned to a unique ID instead of relying on the names for searches. Also each time these indices are reported, the method and search engines used must be mentioned to avoid ambiguity as much as possible.
The validity of scholar indices is a limitation because they do not weigh fields of varying importance. For example, John Pople, a theoretical chemist who has received a Nobel Prize, fares poorly in sets of h-indices.
Applicability of scholar indices has limitations when scholars emphasise practical advancement in an area of endeavour rather than the publishing of papers. It is also difficult to document works of an earlier decade as online documents, thereby decreasing their online impact factor. For example, the Scopus is an online database that calculates scholar indices for documents found after 1995 only. Any earlier works are not documented or evaluated.
Jorge E. Hirsch suggested the h-index should inform hiring, promotion, funding, tenure, award and societal committees to make judicious decisions. However, because of their limitations they are best viewed in a balanced way.
References
- 1 2 McDonald, Kim (8 November 2005). "Physicist Proposes New Way to Rank Scientific Output". PhysOrg. Retrieved 13 May 2010.
- 1 2 3 Perish Software Harzing, A.W. (2007) Publish or Perish, available from http://www.harzing.com/pop.htm
- ↑ http://www.cs.odu.edu/~mln/pubs/2007-10-09-h-index.html
- 1 2 3 4 https://www.scopus.com/home.url
- ↑ https://scholar.google.com/
- ↑ Mohammad Hamdaqa and A. Hamou-Lhadj, "Citation Analysis: An Approach for Facilitating the Understanding and the Analysis of Regulatory Compliance Documents", In Proc. of the 6th International Conference on Information Technology, Las Vegas, USA
- ↑ Kear, Robin & Colbert-Lewis, Danielle, (2011). "Citation searching and bibliometric measures,". College & Research Libraries News. 72 (8): 470–474.
- ↑ Amanda L. Werhane, UW-Madison. "The Hirsch index of scholarly output: New measure, ongoing debate" (PDF). Retrieved 22 April 2014.
- ↑ Zhang, C-T (2009). "The e-Index, Complementing the h-Index for Excess Citations". PLoS ONE. 4 (5): e5429. doi:10.1371/journal.pone.0005429. PMC 2673580. PMID 19415119.
- ↑ Erdős Number Project. http://www.oakland.edu/enp/
- ↑ http://arnetminer.org/viewperson.do?aid=833230&name=C.%20E.%20Shannon (Shannon h-index)
- ↑ LEO EGGHE,. "Theory and practise of the g-index". Scientometrics. Akadémiai Kiadó, co-published with Springer Science+Business Media B.V., Formerly Kluwer Academic Publishers B.V. 69 (69, number 1): 131–152. doi:10.1007/s11192-006-0144-7.
- ↑ Hubs and Authorities.http://nlp.stanford.edu/IR-book/html/htmledition/hubs-and-authorities-1.html
- ↑ Hubs and Authorities.http://www.cs.ucr.edu/~vagelis/classes/CS172/publications/kleinberg98authoritative.pdf
- ↑ Background Terminology
- ↑ Hierarchical Link Analysis for Ranking Web Data. http://renaud.delbru.fr/doc/pub/eswc2010-ding-slides.pdf
- ↑ HITS Algorithm - Hubs and Authorities on the Internet. http://www.math.cornell.edu/~mec/Winter2009/RalucaRemus/Lecture4/lecture4.html