Santa Maria in Calanca
| Santa Maria in Calanca | ||
|---|---|---|
 | ||
| ||
 Santa Maria in Calanca | ||
|
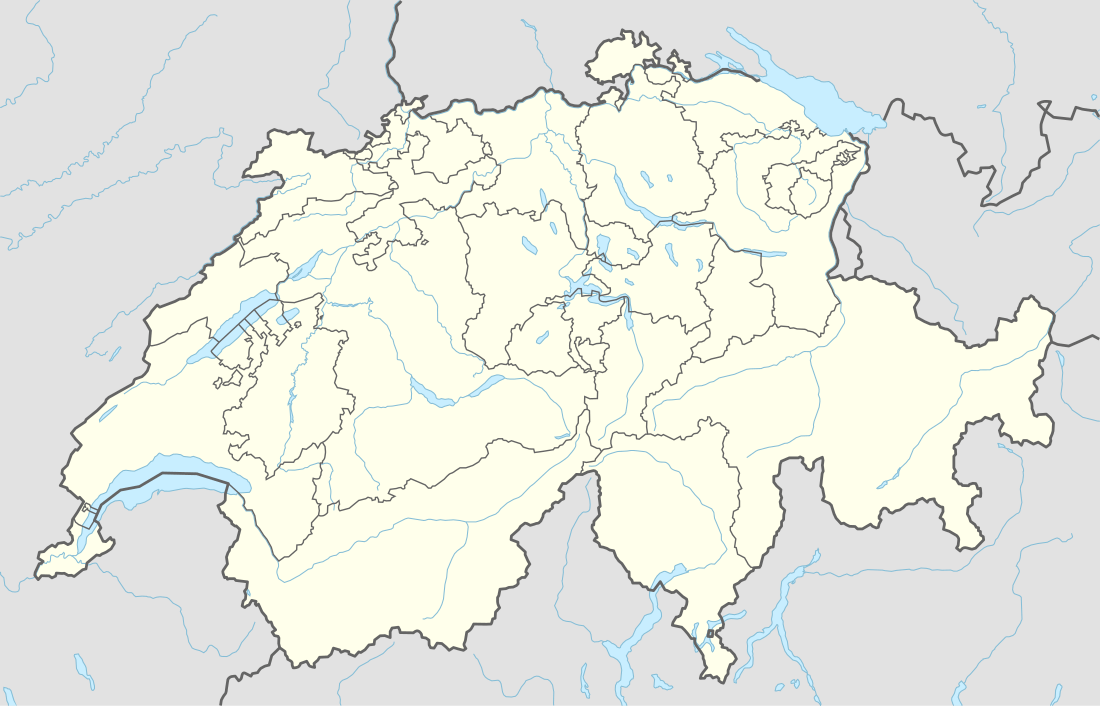
Location of Santa Maria in Calanca  Santa Maria in Calanca Santa Maria in Calanca (Canton of Graubünden) | ||
| Coordinates: 46°16′N 9°9′E / 46.267°N 9.150°ECoordinates: 46°16′N 9°9′E / 46.267°N 9.150°E | ||
| Country | Switzerland | |
| Canton | Graubünden | |
| District | Moesa | |
| Area[1] | ||
| • Total | 9.31 km2 (3.59 sq mi) | |
| Elevation | 955 m (3,133 ft) | |
| Population (Dec 2016[2]) | ||
| • Total | 110 | |
| • Density | 12/km2 (31/sq mi) | |
| Postal code | 6541 | |
| SFOS number | 3810 | |
| Surrounded by | Braggio, Buseno, Castaneda, Cauco, Grono, Selma, Verdabbio | |
| Website |
santamariaic SFSO statistics | |

Santa Maria in Calanca is a municipality in the Moesa Region in the Swiss canton of Graubünden.
History
Santa Maria in Calanca is first mentioned in 1219 as sancte Marie in Calanca.[3]
Geography
Santa Maria in Calanca has an area, as of 2006, of 9.3 km2 (3.6 sq mi). Of this area, 5.6% is used for agricultural purposes, while 73.2% is forested. Of the rest of the land, 1.6% is settled (buildings or roads) and the remainder (19.6%) is non-productive (rivers, glaciers or mountains).[4]
Before 2017, the municipality was located in the Calanca sub-district of the Moesa district, after 2017 it was part of the Moesa Region.[5]
Demographics
Santa Maria in Calanca has a population (as of 31 December 2016) of 110.[2] As of 2008, 4.4% of the population was made up of foreign nationals.[6] Over the last 10 years the population has decreased at a rate of -5.3%. Most of the population (as of 2000) speaks Italian (86.5%), with German being second most common ( 9.9%) and French being third ( 2.7%).[4]
As of 2000, the gender distribution of the population was 47.7% male and 52.3% female.[7] The age distribution, as of 2000, in Santa Maria in Calanca is; 4 children or 3.6% of the population are between 0 and 9 years old. 2 teenagers or 1.8% are 10 to 14, and 6 teenagers or 5.4% are 15 to 19. Of the adult population, 7 people or 6.3% of the population are between 20 and 29 years old. 14 people or 12.6% are 30 to 39, 21 people or 18.9% are 40 to 49, and 18 people or 16.2% are 50 to 59. The senior population distribution is 14 people or 12.6% of the population are between 60 and 69 years old, 15 people or 13.5% are 70 to 79, there are 9 people or 8.1% who are 80 to 89, and there is 1 person who is 90 to 99.[6]
In the 2007 federal election the most popular party was the SP which received 46.4% of the vote. The next three most popular parties were the SVP (25.5%), the CVP (16.7%) and the FDP (11.5%).[4]
In Santa Maria in Calanca about 64.6% of the population (between age 25-64) have completed either non-mandatory upper secondary education or additional higher education (either university or a Fachhochschule).[4]
Santa Maria in Calanca has an unemployment rate of 0.15%. As of 2005, there were 14 people employed in the primary economic sector and about 8 businesses involved in this sector. 3 people are employed in the secondary sector and there are 2 businesses in this sector. 4 people are employed in the tertiary sector, with 4 businesses in this sector.[4]
The historical population is given in the following table:[3]
| year | population |
|---|---|
| 1808 | 207 |
| 1850 | 206 |
| 1900 | 163 |
| 1950 | 202 |
| 2000 | 111 |
Heritage sites of national significance
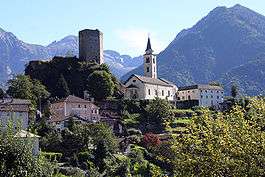
The Castello and the Church of S. Maria Assunta are listed as Swiss heritage sites of national significance.[8]
The Castello or Torre di Sta. Maria is a large pentagonal tower house with a two story vaulted ceiling. The actual construction date is unknown but it is first mentioned in 1253.
The Church of Santa Maria Assunta was first mentioned in 1291. The baroque coffered ceiling from the 17th Century is particularly noteworthy.
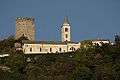 The Castello and Church of S. Maria Assunta
 Coffered ceiling in the church
 Side altars in the church
 Main altar of the church
References
- ↑ Arealstatistik Standard - Gemeindedaten nach 4 Hauptbereichen
- 1 2 Swiss Federal Statistical Office - STAT-TAB, online database – Ständige und nichtständige Wohnbevölkerung nach institutionellen Gliederungen, Geburtsort und Staatsangehörigkeit (in German) accessed 30 August 2017
- 1 2 Santa Maria in Calanca in German, French and Italian in the online Historical Dictionary of Switzerland.
- 1 2 3 4 5 Swiss Federal Statistical Office accessed 22-Oct-2009
- ↑ Swiss Federal Statistical Office - Amtliches Gemeindeverzeichnis der Schweiz - Mutationsmeldungen 2016 accessed 16 February 2017
- 1 2 Graubunden Population Statistics Archived 2009-08-27 at the Wayback Machine. (in German) accessed 21 September 2009
- ↑ Graubunden in Numbers Archived 2009-09-24 at the Wayback Machine. (in German) accessed 21 September 2009
- ↑ Swiss inventory of cultural property of national and regional significance Archived 2009-05-01 at the Wayback Machine. 21.11.2008 version, (in German) accessed 22-Oct-2009
| Wikimedia Commons has media related to Santa Maria in Calanca. |
External links
- Official website (in Italian)
- Santa Maria in Calanca (castle) in German, French and Italian in the online Historical Dictionary of Switzerland.
- Santa Maria in Calanca in German, French and Italian in the online Historical Dictionary of Switzerland.