Road toll (Australia and New Zealand)
Road toll is the term used in New Zealand and Australia for the number of deaths caused annually by road accidents.
New Zealand
New Zealand reports a daily, monthly, quarterly and annual nationwide road toll,[1] plus special period figures for a number of holiday periods:[2]
- Christmas — New Year : between 4pm on 24 December (22 or 23 December if 24 December falls on a weekend) and 6am on 3 January (4 or 5 January if 1 and/or 2 January fall on a weekend or 2 January falls on a Friday).
- Easter — from 4pm on the day before Good Friday and 6am the following Tuesday.
- Queen's Birthday — from 4pm on the Friday before the first Monday in June to 6am the following Tuesday.
- Labour Day|Labour Weekend — from 4pm on the Friday before the last Monday in October to 6am the following Tuesday.
The road toll includes deaths which occur within 7 days of a road accident as a result of injuries received in the accident. Deaths of pedestrians and cyclists are included, but deaths from vehicular accidents not on legal roads (e.g. on farms) are excluded.
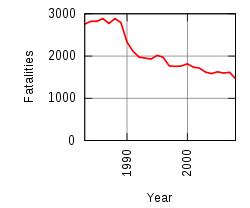
The New Zealand road toll has exhibited a downward trend since the late 1980s through to 2010, which was attributed to a number of factors:
- A reduction in drink driving, due to public education and strict policing.
- Improvements in vehicle safety.
- An increase in the wearing of seat belts due to public education
- Hazard mitigation works on dangerous stretches of road.
- Reduction of speed limits in some accident blackspots and areas frequented by vulnerable road users.
Recent NZ Road Toll Figures
Road toll statistics are available from as far back as 1921, when records began.[3] Here are some figures from the last few years (dashes indicate figures not published or unavailable).
| Year | Road deaths | Fatal crashes | No. of injuries |
|---|---|---|---|
| 2012 | 308 | - | 12,122 |
| 2013 | 253 | - | 11,781 |
| 2014 | 293 | - | 11,219 |
| 2015 | 319 | - | 12,270 |
| 2016 | 327 | 285 | 12,456 |
| 2017 | 380 | 344 | - |
NZ Deaths per capita / per 000 vehicles
Road deaths and Injuries since 2000[4]
| Year | Population (000) | Vehicles (000) | No. of fatalities | Per 100,000 population | Per 10,000 vehicles | No. of injuries | Per 100,000 population | Per 10,000 vehicles |
|---|---|---|---|---|---|---|---|---|
| 2000 | 3830.8 | 2601.7 | 462 | 12.1 | 1.8 | 10962 | 286 | 42.1 |
| 2001 | 3850.1 | 2633.2 | 455 | 11.8 | 1.7 | 12368 | 321 | 47.0 |
| 2002 | 3939.1 | 2709.5 | 405 | 10.3 | 1.5 | 13918 | 353 | 51.4 |
| 2003 | 4009.2 | 2801.0 | 461 | 11.5 | 1.6 | 14372 | 359 | 51.3 |
| 2004 | 4060.9 | 2920.7 | 435 | 10.7 | 1.5 | 13890 | 342 | 47.6 |
| 2005 | 4098.3 | 3030.4 | 405 | 9.9 | 1.3 | 14451 | 353 | 47.7 |
| 2006 | 4139.5 | 3124.3 | 393 | 9.5 | 1.3 | 15174 | 367 | 48.6 |
| 2007 | 4228.3 | 3189.1 | 421 | 10.0 | 1.3 | 16013 | 379 | 50.2 |
| 2008 | 4268.6 | 3247.8 | 366 | 8.6 | 1.1 | 15174 | 356 | 46.7 |
| 2009 | 4315.8 | 3220.3 | 384 | 8.9 | 1.2 | 14541 | 337 | 45.2 |
| 2010 | 4367.8 | 3230.6 | 375 | 8.6 | 1.2 | 14031 | 321 | 43.4 |
| 2011 | 4405.3 | 3233.6 | 284 | 6.4 | 0.9 | 12574 | 285 | 38.9 |
| 2012 | 4433.0 | 3250.1 | 308 | 6.9 | 0.9 | 12122 | 273 | 37.3 |
| 2013 | 4471.1 | 3304.7 | 253 | 5.7 | 0.8 | 11781 | 264 | 35.6 |
| 2014 | 4509.9 | 3398.1 | 293 | 6.5 | 0.9 | 11219 | 249 | 33.0 |
| 2015 | 4596.7 | 3514.8 | 319 | 6.9 | 0.9 | 12270 | 267 | 34.9 |
| 2016 | 4693.0 | 3656.3 | 327 | 7.0 | 0.9 | 12456 | 265 | 34.1 |
Types of road users killed in NZ
A break down of the types of road users[5] involved in the Roald death toll since 2010 is also revealing;
| Year | Drivers | Passengers | Motor Cyclists | Cyclists | Pedestrians | Other | Total |
|---|---|---|---|---|---|---|---|
| Highest: | 307(1987) | 250 (1973) | 146(1988) | 41 (1957) | 157 (1973) | - | - |
| Lowest: | 49 (1952) | 49 (2013) | 28 (2003) | 5(2016) | 25 (2015/2016) | ||
| 2010 | 180 | 98 | 50 | 10 | 36 | 2 | 375 |
| 2011 | 150 | 61 | 33 | 9 | 31 | 0 | 284 |
| 2012 | 135 | 82 | 50 | 8 | 33 | 0 | 308 |
| 2013 | 125 | 49 | 39 | 8 | 30 | 2 | 253 |
| 2014 | 127 | 70 | 43 | 10 | 43 | 0 | 293 |
| 2015 | 157 | 75 | 54 | 6 | 25 | 2 | 319 |
| 2016 | 163 | 78 | 52 | 5 | 25 | 4 | 327 |
Age of NZ Road Toll Deaths
The following table gives the number of Road Toll deaths by age group,[6] from 2010. The total killed includes unknown aged fatalities.
| Year | 0–14 years | 15–24 years | 25–39 years | 40–59 years | 60+ years | TOTAL |
|---|---|---|---|---|---|---|
| 2010 | 18 | 113 | 76 | 83 | 85 | 375 |
| 2011 | 11 | 82 | 46 | 79 | 65 | 284 |
| 2012 | 14 | 62 | 68 | 78 | 84 | 308 |
| 2013 | 6 | 64 | 41 | 76 | 64 | 253 |
| 2014 | 13 | 61 | 66 | 69 | 81 | 293 |
| 2015 | 8 | 84 | 73 | 79 | 74 | 319 |
| 2016 | 17 | 82 | 64 | 93 | 71 | 327 |
Road Toll by NZ region
Local Body boundary changes mean that records have been kept from 1980 onwards. In November 2010, the Auckland Super City was established. The figures have been altered for Auckland and other regions to allow for this development.[7]
| REGION | Lowest Total | Highest Total | 2012 | 2013 | 2014 | 2015 | 2016 |
|---|---|---|---|---|---|---|---|
| Northland | 7 2011 | 54 1989 | 18 | 21 | 18 | 23 | 27 |
| Auckland | 36 2014 | 197 1987 | 41 | 48 | 36 | 52 | 46 |
| Waikato | 33 2013 | 141 1991 | 65 | 33 | 48 | 69 | 79 |
| Bay of Plenty | 18 2013 | 70 1987 | 23 | 18 | 30 | 29 | 31 |
| Gisborne / Hawke’s Bay | 10 2013 | 64 1986 | 31 | 10 | 19 | 15 | 16 |
| Taranaki | 7 2013 | 45 1991 | 17 | 7 | 11 | 8 | 12 |
| Manawatu/Wanganui | 15 2013 | 81 1987 | 29 | 15 | 34 | 28 | 16 |
| Wellington | 10 2015 | 71 1987 | 11 | 18 | 12 | 10 | 16 |
| Nelson / Marlborough | 5 2015 | 27 1984 | 9 | 9 | 7 | 5 | 10 |
| West Coast | 3 1996 | 18 2001 | 7 | 9 | 9 | 7 | 4 |
| Canterbury | 32 2009 | 96 1989 | 33 | 49 | 38 | 47 | 34 |
| Otago | 11 2009 | 43 1988 | 17 | 14 | 19 | 18 | 20 |
| Southland | 2 2013 | 25 1984 | 7 | 2 | 12 | 8 | 16 |
Tourist Road Toll in New Zealand
Overseas licence holders are involved in just over 6 percent of fatal and injury crashes.[8] In 2016 overseas drivers (those with an overseas drivers licence) were involved in 24 fatal traffic crashes, 114 serious injury crashes and 506 minor injury crashes. In comparison, in total in New Zealand in 2016, there were 286 fatal crashes, 2,099 serious injury crashes and 7,583 minor injury crashes.[9] Over the five years from 2012-2016, 6.2 percent of fatal and injury crashes involved an overseas driver. Over the same period, 4.1 percent of all drivers involved in crashes were overseas drivers.
Australia
In Australia the road toll is reported at a state level. Similar to New Zealand, Australia also reports national figures for special holidays, though usually only for the Christmas and Easter holiday periods.
In 2010, 1367 people lost their lives in road traffic crashes in Australia.[10] While strategies to reduce road toll, including legislation, improvements to vehicle’s which help to make them safer, and educational programs have been developed by the national government, under the 1992 Road Safety Strategy, it is up to the local governments to adopt and enforce these policies.[11] The state of Victoria has implemented several initiatives such as speed camera, random alcohol breath tests, and an integrated state trauma system, which have successfully reduced the number of deaths caused by road traffic crashes.[12]
Random breath testing (“RBT”), utilized throughout Australia, differs from the sobriety check-points commonly used in other countries. In Australia, random breath testing is accomplished by setting up a highly visible road block, wherein all drivers passing through are asked to take an alcohol breath test, regardless of whether there is any cause to believe the driver has been drinking.[13] RBT was shown to reduce alcohol related road toll by 8–71% in fourteen different studies reviewed by Dr. Corinne Peek-Asa.[14] Requiring motorists and passengers to wear seat belts appears to have reduced the road toll in Australia.[15]
See also
References
- ↑ "Road crash statistics". Ministry of Transport, New Zealand.
- ↑ "Holiday road crash statistics". Ministry of Transport, New Zealand.
- ↑ "Historical Road crash statistics". Ministry of Transport, New Zealand.
- ↑ "Historical Road crash statistics". Ministry of Transport, New Zealand.
- ↑ "Historical Road crash statistics". Ministry of Transport, New Zealand.
- ↑ "Historical Road crash statistics". Ministry of Transport, New Zealand.
- ↑ "Historical Road crash statistics". Ministry of Transport, New Zealand.
- ↑ Overseas drivers in crashes
- ↑ NZ Transport Overseas Driver Fatalities (Page 3 of PDF)
- ↑ "Accidents Injuries and Fatalities: Transport Related Deaths". 1301.0 – Year Book Australia (2012). Australian Bureau of Statistics. Retrieved 21 July 2014.
- ↑ "Vehicle Collisions in Australia". NSW Compensation Lawyers. Retrieved 21 July 2014.
- ↑ Atkin, C; Freedman, I; Rosenfeld, J; Fitzgerald, M; Kossmann, T (November 2005). The evolution of an integrated state trauma system in Victoria, Australia. Injury. 36. pp. 1277–87. doi:10.1016/j.injury.2005.05.011. PMID 16214472.
- ↑ Homel, R (1990). "Random Breath Testing and Random Stopping Programs in Australia" (PDF). In Wilson, R.J.; Mann, R.E. Drinking and Driving: Advances in Research and Prevention (PDF)
|format=requires|url=(help). Guilford Press. ISBN 0898621704. - ↑ Peek-Asa, C (January 1999). "The Effect of Random Alcohol Screening in Reducing Motor Vehicle Crash Injuries". American Journal of Preventative Medicine. 16 (1): 57–67. doi:10.1016/S0749-3797(98)00116-0.
- ↑ Bhattacharyya, M; Layton, A (1979). "Effectiveness of Seat Belt Legislation on the Queensland Road Toll — An Australian Case Study in Intervention Analysis". Journal of the American Statistical Association. 74 (367): 596–603. doi:10.1080/01621459.1979.10481655.
External links
| Wikinews has related news: New Zealand Christmas-New Year road toll: 20 fatalities |
- "Road crash statistics". Ministry of Transport, New Zealand.
- "Road crash statistics". Australian Government Department of Infrastructure, Transport, Regional Development and Local Government. Archived from the original on 7 February 2009.
- "Road death statistics". New Zealand Transport Agency.
- "Road Casualties — Social Report". Ministry of Social Development. Archived from the original on 18 October 2010.