Quebec general election, 1998
|
| |||||||||||||||||||||||||||||||||||||||||||||
| |||||||||||||||||||||||||||||||||||||||||||||
125 seats in the 36th National Assembly of Quebec 63 seats were needed for a majority | |||||||||||||||||||||||||||||||||||||||||||||
|---|---|---|---|---|---|---|---|---|---|---|---|---|---|---|---|---|---|---|---|---|---|---|---|---|---|---|---|---|---|---|---|---|---|---|---|---|---|---|---|---|---|---|---|---|---|
| Turnout | 78.32% | ||||||||||||||||||||||||||||||||||||||||||||
| |||||||||||||||||||||||||||||||||||||||||||||
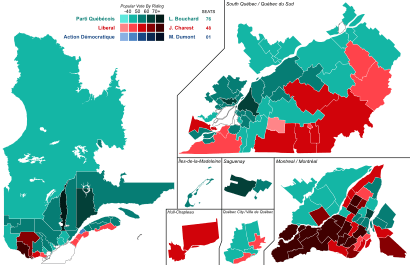 Popular vote by riding. As this is an FPTP election, seat totals are not determined by popular vote, but instead via results by each riding. Click the map for more details. | |||||||||||||||||||||||||||||||||||||||||||||
| |||||||||||||||||||||||||||||||||||||||||||||
.png)

The Quebec general election of 1998 was held on November 30, 1998, to elect members of the National Assembly of the Province of Quebec, Canada. The incumbent Parti Québécois, led by Premier Lucien Bouchard, won re-election, defeating the Quebec Liberal Party, led by Jean Charest.
After the narrow defeat of the PQ's proposal for political independence for Quebec in an economic union with the rest of Canada in the 1995 Quebec referendum, PQ leader Jacques Parizeau resigned. Bouchard left federal politics, where he was leader of the Bloc Québécois in the House of Commons of Canada, to lead the Parti Québécois and become premier.
Jean Charest had also left federal politics, where he had been leader of the Progressive Conservative Party of Canada. Charest was initially seen as a bad fit for the Quebec Liberal Party, and for provincial politics. He later overcame this perception.
In terms of the number of seats won by each of the two parties, the result was almost identical to the previous 1994 general election. However, this time the Liberals won a slightly larger percentage of the popular vote, but nonetheless far fewer seats.
Mario Dumont, leader of the Action démocratique du Québec, repeated his success in winning his own seat, as he had done in the 1994 general election. However, his party also repeated its failure to elect any other member apart from its leader.
Results
The overall results were:[1]
| Party | Party leader | Candi- dates |
Seats | Popular vote | |||||
|---|---|---|---|---|---|---|---|---|---|
| 1994 | Elected | % Change | # | % | % Change | ||||
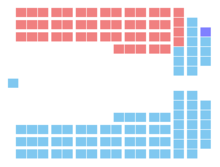
| Parti Québécois | Lucien Bouchard | 124 | 77 | 76 | -1.3% | 1,744,240 | 42.87% | -1.88% | |
| Liberal | Jean Charest | 125 | 47 | 48 | +2.1% | 1,771,858 | 43.55% | -0.85% | |
| Action démocratique | Mario Dumont | 125 | 1 | 1 | - | 480,636 | 11.81% | +5.35% | |
| Socialist Democracy | Paul Rose | 97 | - | - | - | 24,097 | 0.59% | -0.26% | |
| Equality | Keith Henderson | 24 | - | - | - | 12,543 | 0.31% | +0.02% | |
| Bloc Pot | Marc-Boris St-Maurice | 24 | * | - | * | 9,944 | 0.24% | * | |
| Natural Law | Allen Faguy | 35 | - | - | - | 5,369 | 0.13% | -0.72% | |
| Marxist–Leninist | 24 | - | - | - | 2,747 | 0.07% | +0.04% | ||
| Innovator | 20 | - | - | - | 2,484 | 0.06% | +0.01% | ||
| Communist | 20 | - | - | - | 2,113 | 0.05% | +0.02% | ||
| Independent/No designation | 39 | - | - | - | 12,441 | 0.31% | -1.38% | ||
| Total | 657 | 125 | 125 | - | 4,068,472 | 100% | |||
| Source: Elections Quebec | |||||||||
| Note: * Party did not nominate candidates in the previous election. | |||||||||
Note:
* Party did not nominate candidates in the previous election.
| Party | Seats | Second | Third | Fourth | Fifth | Sixth | Seventh | Eighth | Ninth | Tenth | |
|---|---|---|---|---|---|---|---|---|---|---|---|
| Parti Québécois | 76 | 47 | 1 | ||||||||
| Liberal | 48 | 75 | 2 | ||||||||
| Action démocratique | 1 | 2 | 117 | 5 | |||||||
| Socialist Democracy | 56 | 33 | 6 | 2 | |||||||
| Equality | 1 | 3 | 12 | 1 | 4 | 2 | 1 | ||||
| Bloc Pot | 1 | 17 | 6 | ||||||||
| Natural Law | 7 | 14 | 10 | 3 | 1 | ||||||
| Marxist–Leninist | 2 | 5 | 11 | 2 | 4 | ||||||
| Innovator | 2 | 7 | 8 | 3 | |||||||
| Communist | 2 | 3 | 4 | 6 | 3 | 2 | |||||
| Independent | 1 | 9 | 14 | 9 | 3 | 2 | 1 | ||||
See also
External links
- CBC TV video clip
- Results by party (total votes and seats won) [dead link]
- Results for all ridings [dead link]
References
- ↑ "Résultats officiels par parti politique pour l'ensemble des circonscriptions". Directeur général des élections du Québec. Retrieved 2012-02-03.
| General elections | |
|---|---|
| Municipal elections | |
| Referendums | |
See also: List of Quebec by-elections | |