QFL diagram
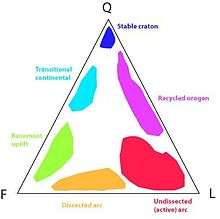
QFL triangle showing schematic plots of common sand compositions
A QFL diagram or QFL triangle is a type of ternary diagram that shows compositional data from sandstones and modern sands, point counted using the Gazzi-Dickinson method. The abbreviations used are as follows:
- Q - quartz
- F - feldspar
- L - lithic fragments
In general, the most contentious item counted is chert, which is usually counted as a lithic fragment, but is sometimes better suited in the Q pole. When this happens, the pole is renamed 'Qt' instead of Q.
The importance of a QFL triangle is mainly demonstrated in tectonic exercises. As first demonstrated in the 1979 paper by Bill Dickinson and Chris Suczek,[1] the composition and provenance of a sandstone is directly related to its tectonic environment of formation.
- Craton sands are clustered near the Q pole. As sandstones, these are known as quartz arenites.
- Transitional continental sands are along the QF line. As sandstones, these are known as arkoses.
- Basement uplift sands are near the F pole. This includes "thick-skinned tectonics." As sandstones, these are known as arkoses.
- Recycled orogen sands plot near the Q pole, but with significant F and L components. This includes "thin-skinned tectonics" common in subduction back-arc thrusting. As sandstones, these are known as lithic sandstones.
- Arc sands plot along the F and L line, with sometimes significant Q components. Clustering near the F pole indicates a dissected arc, and clustering near the L pole indicates an undissected, or new arc. As sandstones, these are known as arkoses and/or lithic sandstones.
References
- ↑ Dickinson, W.R., Suczek, C.A., 1979, Plate tectonics and sandstone compositions: American Association of Petroleum Geologist, 63, 2164–2182
This article is issued from
Wikipedia.
The text is licensed under Creative Commons - Attribution - Sharealike.
Additional terms may apply for the media files.