Population growth of Munich

This article contains the population growth of Munich via tables and graphs.
Population growth
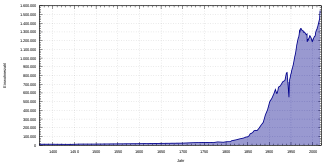
The population of Munich was only 24,000 in 1700, but it doubled every 30 years, and in 1852 the population exceeded 100,000, qualifying it a large city (Großstadt) by German administrative standards. By 1883, Munich had a population of 250,000; this doubled to 500,000 in 1901, making Munich the third largest city in the Deutsches Reich after Berlin and Hamburg.
The physical effects of the Second World War are clearly visible. Towards the end of the war, 90% of the historical old town had been destroyed in 73 aerial raids and half of the city was in ruins. Estimates for the impact of these raids on the population offer the figure of 6,000 dead. In total, Munich lost 34% of its population, with 279,000 people displaced through evacuation, migration, deportation, and made homeless through aerial attacks. The total population decreased from 829,000 in May 1939 to 550,000 in May 1945. The prewar population level was not regained until 1950.
Shortly before the city's 800th anniversary, on 15 December 1957, the millionth resident of Munich was born, making Munich the latest city to reach a population of one million out of 70 cities worldwide. According to the Bavarian National Office for Statistics and Data Processing, the official figure for the population of Munich was 1,259,677 in December 2005 (only principal residences and with adjustments from other national offices). As of June 2007, it stood at 1,305,525.
The following summary shows the population according to historical local data. Up to 1824 the figures are mainly estimates; after that they are census results or official statistics from the local authorities. From 1871 onward, the figures given refer to the "population present in the town (ortsanwesende Bevölkerung); from 1925 the figures are the "resident population" (Wohnbevölkerung), and from since 1987 the figures are for the "population at the place of main residence" (Bevölkerung am Ort der Hauptwohnung). Before 1871, figures are from irregular survey methods.
From 1369 to 1944
|
|
|
¹ Census figures
From 1945 to 1989
|
|
|
¹ Census figures
From 1990
|
|
|
¹ Census figures
Source: Bavarian Regional Authority for Statistics and Data Handling (Bayerisches Landesamt für Statistik und Datenverarbeitung).
Population forecast
The Bertelsmann Foundation provides data for population and population growth for 2,959 municipalities in Germany (January 2006 publication). In Munich, the population is forecast to rise by 7.8% between 2003 and 2020 (96,988 persons).
Projected population growth 2003-2020 for Munich (principal residences):
| Date | Inhabitants |
|---|---|
| 31 December 2010 | 1,314,947 |
| 31 December 2015 | 1,340,514 |
| 31 December 2020 | 1,344,861 |
Source: Bertelsmann Foundation
In the city administration's 2002 planning forecast, a 2% rise of the legally resident population (principal and secondary residences) between 2001 and 2015 is predicted. For immigration, a 7.2% rise is predicted and for stagnation, a decrease of 1.7%. Absolute population trend 2001-2015 - Forecast for Munich (principal and secondary residences):
| Year | Planning forecast |
Projected Immigration |
Projected Stagnation |
|---|---|---|---|
| 31 December 2001 | 1,404,000 | 1,404.000 | 1,404,000 |
| 31 December 2005 | 1,421,000 | 1,447.000 | 1,405,000 |
| 31 December 2010 | 1,421,000 | 1,486.000 | 1,386,000 |
| 31 December 2015 | 1,432,000 | 1,505.000 | 1,380,000 |
Source: Munich Statistical Office (Statistisches Amt der Landeshauptstadt München).
Population structure
In December 2005, the proportion of foreigners was 23.3% or 300,129 persons in absolute figures. The largest groups of these are Turks (43.309), Croatians (24,866), Serbians (24,439), Greeks (22,486), Austrians (21,411) and Italians (20,847). 37% of foreigners in Munich come from countries within the European Union.
| Population | As of 31 December 2005 |
|---|---|
| Legitimate Population | 1,436,725 |
| of which male | 707,047 |
| female | 729,678 |
| Inhabitants with principal residence | 1,288,307 |
| of which male | 623,920 |
| female | 664,387 |
| Inhabitants with secondary residence | 148,418 |
| of which male | 83,127 |
| female | 65,291 |
| Germans with principal residence | 988,178 |
| of which male | 466,400 |
| female | 521,778 |
| Foreigners with principal residence | 300,129 |
| of which male | 157,520 |
| female | 142,609 |
| Foreigner proportion in % | 23.3 |
Source: Munich Statistical Office (Statistisches Amt der Landeshauptstadt München).
Age distribution

The following shows the age distribution from the 31 December 2005 (principal residences).
| Age from - to | Inhabitant Count | Proportion in % |
|---|---|---|
| 0 - 5 | 68,853 | 5.3 |
| 6 - 14 | 88,518 | 6.9 |
| 15 - 44 | 575,131 | 44.6 |
| 45 - 64 | 330,516 | 25.7 |
| over 65 | 225,289 | 17.5 |
| Total | 1,288,307 | 100.0 |
Source: Munich Statistical Office (Statistisches Amt der Landeshauptstadt München).
Boroughs
The following number of inhabitants refer to principal residences as of the 31 December 2006.
| Name | Area in km² | Inhabitant Count | Inhabitants per km² |
|---|---|---|---|
| Allach-Untermenzing | 15.45 | 27,730 | 1,795 |
| Altstadt-Lehel | 3.16 | 18,876 | 5,973 |
| Aubing-Lochhausen-Langwied | 34.06 | 37,857 | 1,111 |
| Au-Haidhausen | 4.22 | 54,382 | 12,887 |
| Berg am Laim | 6.31 | 39,009 | 6,182 |
| Bogenhausen | 23.71 | 75,657 | 3,191 |
| Feldmoching-Hasenbergl | 28.71 | 54,245 | 1,889 |
| Hadern | 9.23 | 44,993 | 4,875 |
| Laim | 5.29 | 50,082 | 9,457 |
| Ludwigsvorstadt-Isarvorstadt | 4.39 | 45,736 | 10,418 |
| Maxvorstadt | 4.29 | 46,058 | 10,736 |
| Milbertshofen-Am Hart | 13.37 | 66,992 | 5,011 |
| Moosach | 11.09 | 47,754 | 4,306 |
| Neuhausen-Nymphenburg | 12.92 | 84,604 | 6,548 |
| Obergiesing | 5.71 | 47,007 | 8,232 |
| Pasing-Obermenzing | 16.50 | 63,763 | 3,864 |
| Ramersdorf-Perlach | 19.90 | 102,689 | 5,160 |
| Schwabing-Freimann | 25.67 | 62,430 | 2,432 |
| Schwabing-West | 4.37 | 59,553 | 13,628 |
| Schwanthalerhöhe | 2.07 | 26,103 | 12,610 |
| Sendling | 3.94 | 37,146 | 9,428 |
| Sendling-Westpark | 7.81 | 50,903 | 6,518 |
| Thalkirchen-Obersendling -Forstenried-Fürstenried-Solln | 17.75 | 80,701 | 4,547 |
| Trudering-Riem | 22.45 | 53,915 | 2,401 |
| Untergiesing-Harlaching | 8.06 | 48,075 | 5,965 |
| Munich | 310.43 | 1,326,206 | 4,272 |
Source: Munich Statistical Office (Statistisches Amt der Landeshauptstadt München).[1] (in German)
Ethnic groups
As of 2001 there are about 2,200 Japanese in Munich. The Japanische Internationale Schule München, an international primary and junior high school, serves some Japanese students. Others may go to the Munich International School or German schools. As of about 2001 most Japanese residents of Munich work in the electronics sector and stay in shifts of 3-5 years.[2]
As of 2014 there are about 9,500 French people in Munch. The Lycée Jean Renoir is the French international school serving families in Munich.[3] Like in much of Germany, the French population has surged dramatically in recent years in the Munich area, becoming one of the fastest growing foreign communities in the city.
See also
Literature
- Kaiserliches Statistisches Amt (Hrsg.): Statistisches Jahrbuch für das Deutsche Reich, 1880-1918 (in German)
- Statistisches Reichsamt (Hrsg.): Statistisches Jahrbuch für das Deutsche Reich, 1919-1941/42 (in German)
- Deutscher Städtetag (Hrsg.): Statistisches Jahrbuch Deutscher Gemeinden , 1890 ff. (in German)
- Statistisches Bundesamt (Hrsg.): Statistisches Jahrbuch für die Bundesrepublik Deutschland, 1952 ff. (in German)
Data sources
- ↑ Statistisches Amt der Landeshauptstadt - Bevölkerungszahlen Archived 12 March 2007 at the Wayback Machine.
- ↑ Behr, Sabine. "Erster Spatenstich für japanische Schule" (Archive). Die Welt. 7 November 2001. Retrieved on 6 January 2014. "Rund 2200 Japaner leben derzeit in München. Sie bleiben durchschnittlich drei bis fünf Jahre hier. Die meisten von ihnen arbeiten in der Elektronikbranche. Die Kinder können, je nach Deutschkenntnissen auch deutsche Schulen oder die Munich International School in Starnberg besuchen."
- ↑ (in German) Hochkeppel, Oliver. "Lernen wie Gott in München" (Archive). Süddeutsche Zeitung. 7 November 2014. Retrieved on 18 August 2015. "Nicht, dass alle fast 9500 in München lebenden Franzosen - rechnet man die frankophone Gemeinde dazu, sind es noch ein paar tausend mehr - sich in Sendling oder Giesing angesiedelt hätten. Aber ihre Kinder, die gehen vorzugsweise hier zur Schule: auf das Lycée Jean Renoir."