Piper diagram
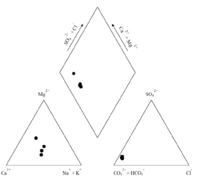
A piper diagram is a graphical representation of the chemistry of a water sample or samples.
The cations and anions are shown by separate ternary plots. The apexes of the cation plot are calcium, magnesium and sodium plus potassium cations. The apexes of the anion plot are sulfate, chloride and carbonate plus hydrogen carbonate anions. The two ternary plots are then projected onto a diamond.[2] The diamond is a matrix transformation of a graph of the anions (sulfate + chloride/ total anions) and cations (sodium + potassium/total cations).[3]
The required matrix transformation of the anion/cation graph is:

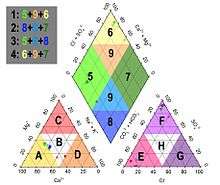
The piper diagram is suitable for comparing the ionic composition of a set of water samples, but does not lend itself to spatial comparisons. For geographical applications, the Stiff diagram and Maucha diagram are more applicable, because they can be used as markers on a map.[4] Colour coding of the background of the Piper diagram allows linking Piper Diagrams and maps[5]
Water samples shown on the Piper diagram can be grouped in hydrochemical facies.[6] The cation and anion triangles can be separated in regions based on the dominant cation(s) or anion(s) and their combination creates regions in the diamond shaped part of the diagram.
Software
- HyCA Commercial software available from KWR waterware
- Grapher Commercial software available from Golden Software, Inc.
- AqQA Commercial software available from RockWare, Inc.
- AquaChem Commercial software from Waterloo Hydrogeolgic
- ChemPoint Pro Commercial software from Starpoint software, Inc.
- The Geochemist's Workbench Commercial software from Aqueous Solutions LLC
- GWB Student Edition Free student edition of the popular geochemical modeling software package.
- GW Chart Free software for creating piper diagrams from the United States Geological Survey
- RockWorks Utilities Commercial software from RockWare, Inc.
- EnviroInsite Commercial software from EI LLC.
- Origin 9.1 commercial software from Originlab can create Piper diagrams from spreadsheet data.
- Piper 2.0 in HydroOffice 2012 - commercial tool in HydroOffice software can produce variable types of Piper plots in vector graphics
- ioGAS Commercial software widely used by geochemists.
- The supplementary material of Peeters (2014) has a free and open-source implementation of the Piper diagram in Python
References
| Wikimedia Commons has media related to Piper diagram. |
- ↑ Love, D.; Moyce, W.; Ravengai, S. (2006). "Livelihood challenges posed by water quality in the Mzingwane and Thuli river catchments, Zimbabwe" (PDF). 7th WaterNet/WARFSA/GWP-SA Symposium, Lilongwe, Malawi. Retrieved 2008-06-20.
- ↑ Piper, A.M. (1953). A Graphic Procedure in the Geochemical Interpretation of Water Analysis. Washington D.C.: United States Geological Survey. OCLC 37707555. ASIN B0007HRZ36.
- ↑ Rao, N. Srinivasa (December 1998). "MHPT.BAS: a computer program for modified Hill–Piper diagram for classification of ground water". Computers & Geosciences. 24 (10): 991–1008. Bibcode:1998CG.....24..991R. doi:10.1016/S0098-3004(98)00083-1.
- ↑ Velasco, V.; Tubau, I.; Vázquez-Suñè, E.; Gogu, R.; Gaitanaru, D.; Alcaraz, M.; Serrano-Juan, A.; Fernàndez-Garcia, D.; Garrido, T.; Fraile, J.; Sanchez-Vila, X.; Sep (2014). "GIS-based hydrogeochemical analysis tools (QUIMET)". Computers & Geosciences. 70: 164–180. Bibcode:2014CG.....70..164V. doi:10.1016/j.cageo.2014.04.013.
- ↑ Peeters, Luk (2014-01-01). "A Background Color Scheme for Piper Plots to Spatially Visualize Hydrochemical Patterns". Groundwater. 52 (1): 2–6. doi:10.1111/gwat.12118. ISSN 1745-6584.
- ↑ Sadashivaiah, C.; Ramakrishnaiah, C.R.; Ranganna, G. (2008). "Hydrochemical Analysis and Evaluation of Groundwater Quality in Tumkur Taluk, Karnataka State, India" (HTML). International Journal of Environmental Research and Public Health. Retrieved 2017-02-07.
| Wikimedia Commons has media related to Ternary plots. |