Opinion polling for the next Belgian federal election
In the run up to the next Belgian federal election, various organisations carry out opinion polling to gauge voting intention in Belgium. Results of such polls are displayed in this article.
The date range for these opinion polls are from the previous federal election, held on 25 May 2014, to the present day. The results of the opinion polls conducted on a nationwide basis are usually split into separate numbers for the three Belgian regions. They are therefore split across the tables in the sections below, but seat projections for the Belgian Chamber are presented together.
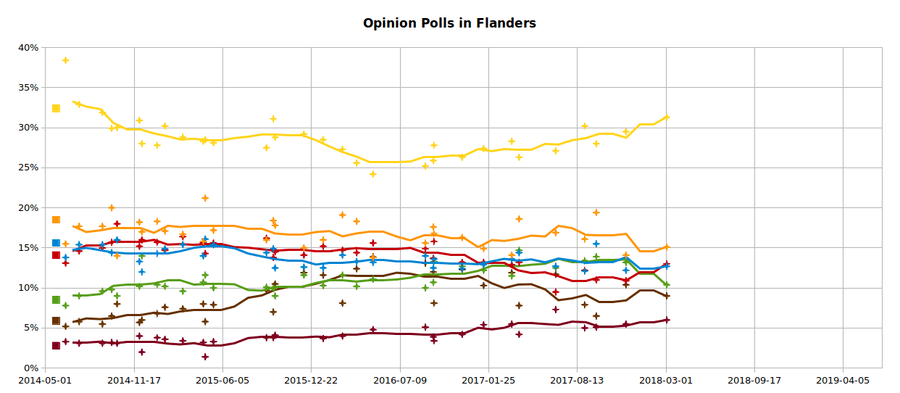
Flanders
The graph and the table below show the results for the opinion polls conducted in the Flemish Region, and for polls conducted nationwide the part of the results related to the Flemish Region. In the graph, the squares mark the election results, the stars the individual opinion poll results, and the trend line the floating average for the opinion poll results with a window of plus/minus three months.
| Date(s) conducted | Polling firm | Newspaper | Sample size | N-VA | CD&V | Open Vld | sp.a | Groen | Vlaams Belang | PVDA | Others | Lead | Government | Opposition | Lead |
|---|---|---|---|---|---|---|---|---|---|---|---|---|---|---|---|
| 20–27 September 2018 | Ipsos | RTL TVi / Le Soir / VTM / Het Laatste Nieuws [1] | 1,000 | 25.0% | 17.2% | 12.8% | 12.1% | 14.1% | 11.3% | 4.4% | 3.1% | 7.8% | 55% | 41.9% | 13.1% |
| 29 May–6 June 2018 | Ipsos | RTL TVi / Le Soir / VTM / Het Laatste Nieuws [2] | 1,000 | 26.5% | 15.3% | 13.9% | 11.7% | 12.4% | 9.7% | 6.2% | 4.3% | 11.2% | 55.7% | 40% | 15.7% |
| 26 February–17 March 2018 | TNS Kantar | RTBF / VRT / De Standaard / La Libre [3] | 1,003 | 32.4% | 16.4% | 14.7% | 9.5% | 13.8% | 7.5% | 4.9% | 1.0% | 16.0% | 63.5% | 35.5% | 28.0% |
| 27 February–6 March 2018 | Ipsos | RTL TVi / Le Soir / VTM / Het Laatste Nieuws [4] | 965 | 31.5% | 15.1% | 12.7% | 13.0% | 10.4% | 9.0% | 6.0% | 2.5% | 16.4% | 59.1% | 38.4% | 20.7% |
| 27 November–4 December 2017 | Ipsos | RTL TVi / Le Soir / VTM / Het Laatste Nieuws [5] | 995 | 29.5% | 14.1% | 12.2% | 10.9% | 13.2% | 10.4% | 5.5% | 4.2% | 15.4% | 55.8% | 40.0% | 15.8% |
| 11 September–8 October 2017 | TNS Kantar | La Libre / RTBF / VRT / De Standaard | 1,045 | 28.0% | 19.4% | 15.5% | 11.0% | 13.9% | 6.5% | 5.1% | 0.6% | 8.6% | 62.9% | 36.5% | 26.4% |
| 25 August–3 September 2017 | Ipsos | RTL TVi / Le Soir / VTM / Het Laatste Nieuws [6][7] | 959 | 30.2% | 16.1% | 12.1% | 12.2% | 13.4% | 7.9% | 5.0% | N/A | 14.1% | 58.4% | 38.5% | 19.9% |
| 23–27 June 2017 | Dedicated[8] | L'Echo | N/A | 27.1% | 16.9% | 12.7% | 9.5% | 12.5% | 11.7% | 7.3% | 0.7% | 10.2% | 56.7% | 33.7% | 23.0% |
| 27 March–11 April 2017 | TNS Media | VRT / De Standaard[9] | 1,030 | 26.3% | 18.6% | 14.4% | 13.2% | 14.7% | 7.8% | 4.2% | 0.7% | 7.7% | 59.3% | 39.9% | 19.4% |
| 16–20 March 2017 | Dedicated | RTBf / La Libre Belgique[10] | 1,038 | 28.3% | 14.1% | 13.6% | 12.9% | 11.5% | 11.9% | 5.5% | 2.2% | 14.2% | 56.0% | 41.8% | 14.2% |
| 10–17 January 2017 | Ipsos | RTL TVi / Le Soir / VTM / Het Laatste Nieuws [11] | 964 | 27.4% | 14.9% | 12.9% | 13.2% | 12.2% | 10.3% | 5.4% | N/A | 12.5% | 55.2% | 41.1% | 14.1% |
| 24–28 November 2016 | Dedicated | RTBf / La Libre Belgique [12][13] | 1,007 | 26.3% | 16.3% | 12.4% | 13.2% | 12.7% | 12.3% | 4.2% | N/A | 10.0% | 55.0% | 42.4% | 12.6% |
| 14 September–3 October 2016 | TNS Media | VRT / De Standaard[14] | 1,013 | 27.8% | 16.8% | 13.6% | 15.8% | 13.3% | 8.1% | 3.4% | 1.2% | 11% | 58.2% | 40.6% | 17.6% |
| 19–25 September 2016 | Ipsos | RTL TVi / Le Soir / VTM / Het Laatste Nieuws[15] | 983 | 25.9% | 17.6% | 12.5% | 13.7% | 10.7% | 12.0% | 3.9% | N/A | 8.3% | 56.0% | 40.3% | 15.7% |
| 2–6 September 2016 | Dedicated | RTBf / La Libre Belgique [16][17] | 1,002 | 25.2% | 15.6% | 14.0% | 14.9% | 10.0% | 13.1% | 5.1% | 2.1% | 9.6% | 54.8% | 43.1% | 11.7% |
| 6–12 May 2016 | Ipsos | RTL TVi / Le Soir / VTM / Het Laatste Nieuws[18] | 1,045 | 24.2% | 13.8% | 13.2% | 15.6% | 11.1% | 13.9% | 4.8% | N/A | 8.6% | 51.2% | 45.4% | 5.8% |
| 31 March–4 April 2016 | Dedicated | RTBf / La Libre Belgique[19][20] | 975 | 25.6% | 18.3% | 13.3% | 14.4% | 10.2% | 12.4% | N/A | N/A | 7.3% | 57.2% | 37.0% | 20.2% |
| 22 February–9 March 2016 | TNS Media | VRT / De Standaard[21] | 1,005 | 27.3% | 19.1% | 14.1% | 14.7% | 11.6% | 8.1% | 4.0% | N/A | 8.2% | 60.5% | 38.4% | 22.1% |
| 15–20 January 2016 | Ipsos | RTL TVi / Le Soir / VTM / Het Laatste Nieuws[22] | 1,043 | 28.5% | 16.0% | 12.5% | 15.2% | 10.3% | 11.6% | 3.7% | N/A | 12.5% | 57.0% | 40.8% | 16.2% |
| 3–7 December 2015 | Dedicated | RTBf / La Libre Belgique[23] | 990 | 29.2% | 15.0% | 12.6% | 14.1% | 11.6% | 11.9% | N/A | N/A | 14.2% | 56.8% | 37.6% | 19.2% |
| 28 September–4 October 2015 | Ipsos | RTL TVi / Le Soir / VTM / Het Laatste Nieuws[24] | 1,030 | 28.8% | 17.8% | 12.5% | 14.5% | 9.0% | 10.5% | 4.1% | N/A | 11.0% | 59.1% | 38.1% | 21% |
| 22 September–2 October 2015 | TNS Media | VRT / De Standaard[25] | 1,019 | 31.1% | 18.4% | 14.9% | 13.8% | 9.9% | 7.0% | 3.8% | N/A | 12.7% | 64.4% | 34.5% | 29.9% |
| 9–14 September 2015 | Dedicated | RTBf / La Libre Belgique[26] | 745 | 27.5% | 16.0% | 14.4% | 16.2% | 10.1% | 9.7% | 3.8% | N/A | 11.3% | 57.9% | 39.8% | 18.1% |
| 12–18 May 2015 | Dedicated | RTBf / La Libre Belgique[26] | 761 | 28.1% | 17.2% | 15.4% | 15.6% | 10.0% | 7.9% | 3.3% | N/A | 10.9% | 60.7% | 36.8% | 23.9% |
| 20 April–3 May 2015 | TNS Media | VRT / De Standaard [27] | 1,032 | 28.5% | 21.2% | 16.1% | 14.3% | 11.6% | 5.8% | 1.4% | N/A | 7.3% | 65.8% | 33.1% | 32.7% |
| 20–24 April 2015 | Ipsos | RTL TVi / Le Soir / VTM / Het Laatste Nieuws | 963 | 28.3% | 15.8% | 14.0% | 15.6% | 10.7% | 8.0% | 3.2% | N/A | 12.5% | 58.1% | 37.5% | 20.6% |
| 5–9 March 2015 | Dedicated | RTBF / La Libre Belgique[28] | 691 | 28.8% | 16.7% | 15.4% | 16.4% | 9.6% | 7.4% | 3.4% | 2.3% | 12.1% | 60.9% | 36.8% | 24.1% |
| 23–28 January 2015 | Ipsos | RTL TVi / Le Soir / VTM / Het Laatste Nieuws[29] | 1,035 | 30.2% | 17.1% | 14.9% | 14.7% | 10.2% | 7.6% | 3.6% | N/A | 13.1% | 62.2% | 36.1% | 26.1% |
| 5–11 January 2015 | Ipsos | RTL TVi / Le Soir / VTM / Het Laatste Nieuws[29] | 1,043 | 27.8% | 18.3% | 14.3% | 15.7% | 10.4% | 6.8% | 3.8% | N/A | 9.5% | 60.4% | 36.7% | 23.7% |
| 4–5 December 2014 | AQ Rate | Het Laatste Nieuws | 794 | 28% | 17% | 12% | 16% | 14% | 6% | 2% | N/A | 11% | 57% | 38% | 19% |
| 27 November–1 December 2014 | Dedicated | RTBF / La Libre Belgique[28] | 773 | 30.9% | 18.2% | 13.3% | 15.2% | 10.2% | 5.7% | 4.0% | 2.5% | 12.7% | 62.4% | 35.1% | 27.3% |
| 9–10 October 2014 | AQ Rate | Het Laatste Nieuws | 801 | 30% | 14% | 16% | 18% | 9% | 8% | 3% | N/A | 12% | 60% | 38% | 22% |
| 22 September–3 October 2014 | TNS Media | De Standaard / VRT | 1,023 | 29.9% | 20.0% | 14.4% | 15.7% | 9.8% | 6.5% | 3.2% | N/A | 9.9% | 64.3% | 35.2% | 29.1% |
| 5–9 September 2014 | Dedicated | RTBF / La Libre Belgique[28] | 792 | 31.9% | 17.7% | 15.4% | 15.0% | 9.6% | 5.5% | 3.1% | 1.8% | 14.2% | 65.0% | 33.2% | 31.8% |
| July 2014 | AQ Rate | Het Laatste Nieuws | 880 | 32.9% | 17.7% | 15.4% | 14.6% | 9.0% | 5.8% | 3.1% | N/A | 15.2% | 66.0% | 32.5% | 33.5% |
| June 2014 | AQ Rate | Het Laatste Nieuws | Unknown | 38.4% | 15.5% | 13.8% | 13.1% | 7.8% | 5.2% | 3.3% | N/A | 22.9% | 67.7% | 29.4% | 38.3% |
| 25 May 2014 | Federal election | 32.4% | 18.6% | 15.5% | 14.0% | 8.6% | 5.8% | 2.8% | 2.2% | 13.9% | 66.5% | 31.2% | 35.3% | ||
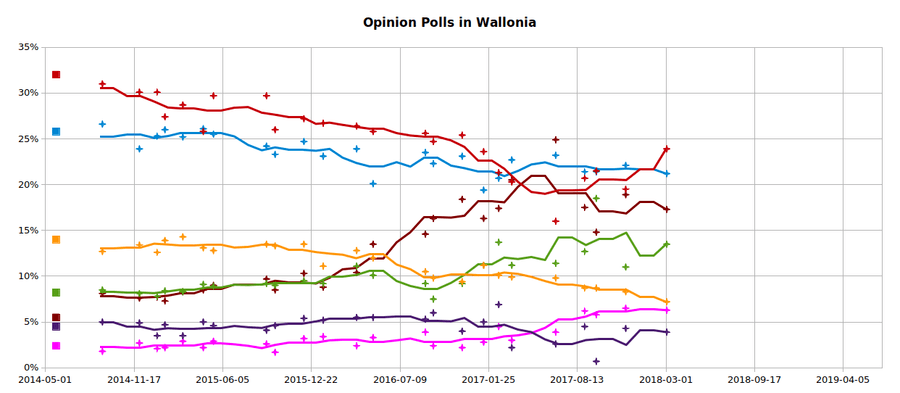
Wallonia
The graph and the table below show the results for the opinion polls conducted in the Walloon Region, and for polls conducted nationwide the part of the results related to the Walloon Region. In the graph, the squares mark the election results, the stars the individual opinion poll results, and the trend line the floating average for the opinion poll results with a window of plus/minus three months.
| Date(s) conducted | Polling firm | Newspaper | Sample size | PS | MR | cdH | Ecolo | PTB | PP | DéFI | DC | Others | Lead | Government | Opposition | Lead |
|---|---|---|---|---|---|---|---|---|---|---|---|---|---|---|---|---|
| 20–27 September 2018 | Ipsos | RTL TVi / Le Soir / VTM / Het Laatste Nieuws [1] | 1,000 | 23.6% | 20.6% | 10.1% | 10.9% | 13.1% | 6.7% | 6.9% | 2.1% | 6% | 3% | 20.6% | 73.4% | 52.8% |
| 29 May–6 June 2018 | Ipsos | RTL TVi / Le Soir / VTM / Het Laatste Nieuws [2] | 1,000 | 23.4% | 20% | 9% | 13.2% | 12.8% | 7.3% | 5.9% | 2.1% | 6.3% | 3.4% | 20% | 71.6% | 51.6% |
| 26 February–17 March 2018 | TNS Kantar | RTBF / VRT / De Standaard / La Libre [30] | 1,003 | 23.2% | 24.1% | 11.1% | 17.5% | 10.6% | 3.4% | 5.6% | 1.0% | 3.5% | 0.9% | 23.2% | 71.4% | 48.2% |
| 27 February–6 March | Ipsos | RTL TVi / Le Soir / VTM / Het Laatste Nieuws[31] | 983 | 23.9% | 21.2% | 7.2% | 13.5% | 17.3% | 4.3% | 6.5% | 1.1% | 5.2% | 2.7% | 21.2% | 73.6% | 52.4% |
| 27 November–3 December 2017 | Ipsos | RTL TVi / Le Soir / VTM / Het Laatste Nieuws[32] | 999 | 19.5% | 22.1% | 8.3% | 11.0% | 18.9% | 3.9% | 6.3% | 2.2% | 7.2% | 2.6% | 22.1% | 68.5% | 46.4% |
| 11 September–8 October 2017 | TNS Kantar | La Libre / RTBF / VRT / De Standaard | 1,076 | 21.5% | 21.4% | 8.7% | 18.5% | 14.8% | 0.7% | 5.8% | N/A | 8.6% | 0.1% | 21.4% | 70.0% | 48.6% |
| 25 August–3 September 2017 | Ipsos | RTL TVi / Le Soir / VTM / Het Laatste Nieuws[33] | 960 | 20.7% | 21.4% | 8.7% | 12.7% | 17.5% | 4.5% | 6.2% | N/A | N/A | 0.7% | 21.4% | 70.3% | 48.9% |
| 23–27 June 2017 | Dedicated[8] | L'Echo | 625 | 16.0% | 23.2% | 9.8% | 11.4% | 24.9% | 2.6% | 3.9% | N/A | 8.2% | 1.7% | 23.2% | 66.0% | 42.8% |
| 16–20 March 2017 | Dedicated | RTBf / La Libre Belgique[10] | 946 | 20.3% | 22.7% | 9.9% | 11.2% | 20.5% | 2.2% | 3.0% | N/A | 10.2% | 2.2% | 22.7% | 67.1% | 44.4% |
| 16–17 February 2017 | iVox | Sudpresse [34] | 1,000 | 21.3% | 20.7% | 10.1% | 13.7% | 17.4% | 6.9% | 4.5% | N/A | 5.5% | 0.6% | 20.7% | 73.9% | 53.2% |
| 10–17 January 2017 | Ipsos | RTL TVi / Le Soir / VTM / Het Laatste Nieuws [11] | 961 | 23.6% | 19.4% | 11.2% | 11.2% | 16.3% | 5.0% | 2.8% | N/A | 3.6% | 4.2% | 19.4% | 70.1% | 50.7% |
| 24–28 November 2016 | Dedicated | RTBf / La Libre Belgique [12][13] | 892 | 25.4% | 23.1% | 9.4% | 9.2% | 18.2% | 4.0% | 2.2% | N/A | N/A | 2.3% | 23.1% | 68.6% | 45.5% |
| 19–25 September 2016 | Ipsos | RTL TVi / Le Soir / VTM / Het Laatste Nieuws[15] | 983 | 24.7% | 22.3% | 9.8% | 7.5% | 16.3% | 6.0% | 2.4% | N/A | N/A | 2.4% | 22.3% | 66.7% | 44.4% |
| 2–6 September 2016 | Dedicated | RTBf / La Libre Belgique [16][17] | 962 | 25.6% | 23.5% | 10.5% | 9.2% | 14.6% | 5.3% | 3.9% | N/A | 7.4% | 2.1% | 23.5% | 69.1% | 45.6% |
| 6–12 May 2016 | Ipsos | RTL TVi / Le Soir / VTM / Het Laatste Nieuws[18] | 1,003 | 25.8% | 20.1% | 12.0% | 10.1% | 13.5% | 5.5% | 3.3% | N/A | N/A | 5.7% | 20.1% | 70.2% | 50.1% |
| 31 March–4 April 2016 | Dedicated | RTBF / La Libre Belgique[19][20] | 967 | 26.4% | 23.9% | 12.8% | 11.1% | 10.4% | 5.5% | 2.4% | N/A | N/A | 2.5% | 23.9% | 68.6% | 44.7% |
| 15–20 January 2016 | Ipsos | RTL TVi / Le Soir / VTM / Het Laatste Nieuws[22] | 1,034 | 26.7% | 23.1% | 11.1% | 9.2% | 8.8% | 5.2% | 3.4% | N/A | N/A | 3.6% | 23.1% | 64.4% | 41.3% |
| 3–7 December 2015 | Dedicated | RTBF / La Libre Belgique[23] | 910 | 27.2% | 24.7% | 13.5% | 9.5% | 10.3% | 5.4% | 3.2% | N/A | N/A | 2.5% | 24.7% | 69.1% | 44.4% |
| 28 September–4 October 2015 | Ipsos | RTL TVi / Le Soir / VTM / Het Laatste Nieuws[24] | 1,017 | 26.0% | 23.3% | 13.3% | 9.0% | 8.5% | 4.6% | 1.7% | N/A | N/A | 2.7% | 23.3% | 63.1% | 39.8% |
| 9–14 September 2015 | Dedicated | RTBf / La Libre Belgique[26] | 643 | 29.7% | 24.2% | 13.5% | 9.2% | 9.7% | 4.1% | 2.6% | N/A | N/A | 3.5% | 24.2% | 68.8% | 44.6% |
| 12–18 May 2015 | Dedicated | RTBf / La Libre Belgique[26] | 680 | 29.7% | 25.5% | 12.8% | 8.9% | 9.0% | 4.6% | 2.9% | N/A | N/A | 4.2% | 25.5% | 67.9% | 42.4% |
| 20–24 April 2015 | Ipsos | RTL TVi / Le Soir / VTM / Het Laatste Nieuws | 952 | 25.8% | 26.1% | 13.1% | 9.1% | 8.5% | 5.0% | 2.2% | N/A | N/A | 0.3% | 26.1% | 63.7% | 37.6% |
| 5–9 March 2015 | Dedicated | RTBF / La Libre Belgique[28] | 678 | 28.7% | 25.2% | 14.3% | 8.3% | 8.3% | 3.5% | 2.9% | N/A | 8.8% | 3.5% | 25.2% | 66.0% | 40.8% |
| 23–28 January 2015 | Ipsos | RTL TVi / Le Soir / VTM / Het Laatste Nieuws[29] | 1,042 | 27.4% | 26.0% | 13.9% | 8.4% | 7.3% | 4.7% | 2.2% | N/A | N/A | 1.4% | 26.0% | 63.9% | 37.9% |
| 5–11 January 2015 ] | Ipsos | RTL TVi / Le Soir / VTM / Het Laatste Nieuws[29] | 1,053 | 30.1% | 25.3% | 12.6% | 7.8% | 7.7% | 3.5% | 2.1% | N/A | N/A | 4.8% | 25.3% | 63.8% | 38.5% |
| 27 November–1 December 2014 | Dedicated | RTBF / La Libre Belgique[28] | 655 | 30.1% | 23.9% | 13.4% | 8.1% | 7.6% | 4.9% | 2.7% | N/A | N/A | 6.2% | 23.9% | 67.7% | 43.8% |
| 5–9 September 2014 | Dedicated | RTBF / La Libre Belgique[28] | 676 | 31.0% | 26.6% | 12.7% | 8.5% | 8.1% | 5.0% | 1.8% | N/A | 6.3% | 4.4% | 26.6% | 67.1% | 40.5% |
| 25 May 2014 | Federal election | 32.0% | 25.8% | 14.0% | 8.2% | 5.5% | 4.5% | 2.4% | 1.2% | 6.4% | 6.2% | 25.8% | 66.6% | 40.8% | ||
Brussels
The table below shows the results for the opinion polls conducted in the Brussels Region, and for polls conducted nationwide the part of the results related to the Brussels Region.
| Date(s) conducted | Polling firm | Newspaper | Sample size | PS | MR | DéFI | Ecolo | cdH | PTB-PVDA | N-VA | Open Vld | sp.a | PP | CD&V | Groen | Vlaams Belang | Others | Lead | Government | Opposition | Lead |
|---|---|---|---|---|---|---|---|---|---|---|---|---|---|---|---|---|---|---|---|---|---|
| 20–27 September 2018 | Ipsos | RTL TVi / Le Soir / VTM / Het Laatste Nieuws [1] | 1000 | 14.9% | 19.5% | 15.8% | 13.1% | 6.3% | 9% | 6.5% | 1.6% | 0.7% | 2% | 1.2% | 2.2% | 2% | 2.8% | 3.7% | 28.8% | 62% | 33.2% |
| 29 May–6 June 2018 | Ipsos | RTL TVi / Le Soir / VTM / Het Laatste Nieuws [2] | 532 | 14.2% | 17% | 15.4% | 11.9% | 7.4% | 9.5% | 6.7% | 2.3% | 0.8% | 2.4% | 0.9% | 1.5% | 2.3% | 7.7% | 2.8% | 26.9% | 60.1% | 33.2% |
| 26 February–17 March 2018 | TNS Kantar | RTBF / VRT / De Standaard / La Libre [30] | 548 | 21.8% | 20.2% | 12.9% | 15.7% | 9.0% | 5.8% | 4.1% | 2.6% | 0.6% | 1.7% | 1.9% | 2.4% | 0.2% | 4.5% | 1.6% | 28.8% | 66.7% | 37.9% |
| 27 February–6 March 2018 | Ipsos | RTL TVi / Le Soir / VTM / Het Laatste Nieuws [35] | 548 | 16.6% | 17.8% | 14.3% | 13.5% | 6.0% | 7.4% | 6.0% | 2.7% | 0.4% | 3.2% | 1.1% | 3.6% | 1.0% | 9.6% | 1.2% | 27.8% | 62.6% | 34.8% |
| 27 November–4 December 2017 | Ipsos | RTL TVi / Le Soir / VTM / Het Laatste Nieuws [32] | 552 | 17.6% | 16.5% | 15.8% | 12.8% | 5.0% | 7.9% | 6.1% | 1.4% | 1.2% | 2.5% | 1.3% | 2.0% | 1.2% | 8.7% | 1.1% | 25.3% | 66.0% | 40.7% |
| 11 September-8 October 2017 | TNS Kantar | La Libre / RTBF / VRT / De Standaard | 753 | 15.1% | 20.7% | 14.3% | 16.7% | 7.6% | 9.7% | 3.9% | 1.7% | 1.0% | 0.8% | 2.2% | 3.4% | 0.5% | 2.4% | 4.0% | 28.5% | 69.1% | 40.6% |
| 25 August–3 September 2017 | Ipsos | RTL TVi / Le Soir / VTM / Het Laatste Nieuws [33] | 469 | 12.1% | 19.8% | 18.4% | 12.3% | 5.8% | 9.0% | 3.4% | 2.0% | 1.5% | 2.5% | 1.8% | 3.0% | 1.5% | N/A | 1.4% | 27.0% | 66.1% | 39.1% |
| 23–27 June 2017 | Dedicated[8] | L'Echo | 679 | 10.9% | 20.7% | 15.7% | 12.5% | 7.9% | 14.1% | 4.1% | 2.0% | 1.0% | 1.7% | 1.8% | 2.3% | 1.9% | 3.4% | 5.0% | 28.6% | 61.1% | 32.5% |
| 16–20 March 2017 | Dedicated | RTBf / La Libre Belgique[10] | 914 | 20.1% | 18.7% | 10.4% | 13.1% | 6.0% | 14.1% | 3.7% | 2.3% | 0.7% | 3.3% | 1.5% | 1.1% | 2.6% | 2.4% | 1.4% | 26.2% | 71.4% | 45.2% |
| 10–17 January 2017 | Ipsos | RTL TVi / Le Soir / VTM / Het Laatste Nieuws [11] | 510 | 18.1% | 18.4% | 9.3% | 10.8% | 7.9% | 12.1% | 5.1% | 2.6% | 1.9% | 2.2% | 1.5% | 2.5% | 1.7% | N/A | 0.3% | 27.6% | 64.3% | 36.7% |
| 24–28 November 2016 | Dedicated | RTBf / La Libre Belgique [12][13] | 892 | 20.4% | 19% | 10.5% | 11.3% | 7% | 9.6% | 3.9% | 2.8% | 0.2% | 3.7% | 2.5% | 2.5% | 1.7% | 5% | 1.4% | 28.2% | 66.9% | 38.7% |
| 19–25 September 2016 | Ipsos | RTL TVi / Le Soir / VTM / Het Laatste Nieuws[15] | 983 | 15.5% | 20.3% | 10.9% | 9.8% | 7.8% | 11.2% | N/A | N/A | N/A | 0.9% | N/A | N/A | N/A | N/A | 4.8% | 20.3%* | 56.1%* | 35.8%* |
| 2–6 September 2016 | Dedicated | RTBf / La Libre Belgique [16][17] | 917 | 19.8% | 20.1% | 11.3% | 12.9% | 6.5% | 7.5% | 4.2% | 2.6% | 1.5% | 3.0% | 1.9% | 1.8% | 2.4% | 4,5% | 0.3% | 28.8% | 66.7% | 37.9% |
| 6–12 May 2016 | Ipsos | RTL TVi / Le Soir / VTM / Het Laatste Nieuws[18] | 505 | 17.7% | 19.7% | 10.7% | 8.9% | 7.7% | 7.8% | N/A | N/A | N/A | 2.0% | N/A | N/A | N/A | N/A | 2.0% | 19.7%* | 54.8%* | 45.1%* |
| 31 March–4 April 2016 | Dedicated | RTBF / La Libre Belgique[19][20] | 918 | 21.1% | 20.2% | 11.1% | 10.2% | 8.8% | 6.1% | 4.0% | 2.6% | N/A | 2.8% | 1.9% | 1.2% | 2.3% | N/A | 0.9% | 28.7% | 63.6% | 34.9% |
| 15–20 January 2016 | Ipsos | RTL TVi / Le Soir / VTM / Het Laatste Nieuws[22] | 537 | 18.2% | 20.7% | 9.8% | 8.3% | 6.8% | 7.0% | N/A | N/A | N/A | 2.1% | N/A | N/A | N/A | 2.7% | 2.5% | 20.7%* | 52.2%* | 31.5%* |
| October 2015 | Ipsos | RTL TVi / Le Soir / VTM / Het Laatste Nieuws | ? | 26% | 23.1% | 3.4% | 9.2% | 11.1% | 8.8% | N/A | N/A | N/A | 5.2% | N/A | N/A | N/A | N/A | 2.9% | 23.1%* | 63.7* | 40.6%* |
| 5–9 March 2015 | Dedicated | RTBF / La Libre Belgique[28] | 907 | 19.7% | 22.6% | 12.3% | 9.4% | 9.9% | 5.6% | 3.5% | 2.6% | 3.1% | 2.2% | 1.3% | 1.8% | 0.8% | 3.6% | 2.9% | 30.0% | 65.9% | 35.9% |
| November 2014 | Dedicated | RTBF / La Libre Belgique[28] | ? | 26.2% | 21.7% | 9.2% | 11.8% | 8.1% | 6.0% | 3.2% | 2.1% | 2.2% | 1.4% | 1.9% | 1.2% | 2.3% | 1.7% | 4.5% | 28.9% | 68.4% | 39.5% |
| September 2014 | Dedicated | RTBF / La Libre Belgique[28] | ? | 23.9% | 23.7% | 11.9% | 11.5% | 10.4% | 3.7% | 2.9% | 3.3% | 1.4% | 1.4% | 2.2% | 0.9% | 1.2% | 2.0% | 0.2% | 32.1% | 66.3% | 34.2% |
| 25 May 2014 | Federal election | 25.6% | 21.9% | 10.8% | 10.5% | 9.4% | 4.0% | 2.6% | 2.6% | 2.0% | 1.8% | 1.7% | * | 1.1% | 5.9% | 3.7% | 28.8% | 65.2% | 36.4% | ||
Seat projections
The table below shows seat projections for the Belgian Chamber of Representatives when given by the reporting newspaper or polling firm.
| Date(s) conducted | Polling firm | Newspaper | N-VA | CD&V | Open Vld |
MR | sp.a | Groen | Vlaams Belang |
PVDA- PTB |
PS | cdH | Ecolo | PP | DéFI | Others | Lead | Government | Opposition | Lead |
|---|---|---|---|---|---|---|---|---|---|---|---|---|---|---|---|---|---|---|---|---|
| 20–27 September 2018 | Ipsos | RTL TVi / Le Soir / VTM / Het Laatste Nieuws [36] | 26 | 17 | 12 | 16 | 11 | 12 | 9 | 9 | 17 | 6 | 7 | 2 | 6 | 0 | 9 | 71 | 79 | 8 |
| 29 May–6 June 2018 | Ipsos | RTL TVi / Le Soir / VTM / Het Laatste Nieuws [37] | 29 | 14 | 12 | 15 | 11 | 11 | 8 | 12 | 17 | 5 | 9 | 2 | 5 | 0 | 12 | 70 | 80 | 10 |
| 26 February–17 March 2018 | TNS Kantar | RTBF / VRT / De Standaard / La Libre [3] | 32 | 14 | 12 | 17 | 7 | 12 | 6 | 10 | 18 | 5 | 12 | 0 | 5 | 0 | 14 | 75 | 75 | 0 |
| 27 February–6 March 2018 | Ipsos | RTL TVi / Le Soir / VTM / Het Laatste Nieuws [4] | 32 | 14 | 11 | 15 | 11 | 10 | 7 | 12 | 18 | 4 | 10 | 0 | 6 | 0 | 14 | 72 | 78 | 6 |
| 27 November–4 December 2017 | Ipsos | RTL TVi / Le Soir / VTM / Het Laatste Nieuws [38] | 30 | 14 | 12 | 15 | 10 | 11 | 8 | 14 | 16 | 5 | 9 | 0 | 6 | 0 | 14 | 71 | 79 | 8 |
| 25 August–3 September 2017 | Ipsos | RTL TVi / Le Soir / VTM / Het Laatste Nieuws [33] | 30 | 14 | 11 | 17 | 11 | 12 | 7 | 13 | 15 | 5 | 9 | 0 | 6 | 0 | 13 | 72 | 78 | 6 |
| 23–27 June 2017 | Dedicated | L'Echo | 26 | 16 | 12 | 18 | 7 | 10 | 10 | 26 | 11 | 4 | 7 | 0 | 3 | 0 | Tie | 72 | 78 | 6 |
| 16–20 March 2017 | Dedicated | RTBf / La Libre Belgique | 28 | 13 | 12 | 18 | 11 | 10 | 10 | 16 | 16 | 6 | 8 | 0 | 2 | 0 | 10 | 71 | 79 | 8 |
| 10–17 January 2017 | Ipsos | RTL TVi / Le Soir / VTM / Het Laatste Nieuws [11] | 29 | 14 | 12 | 17 | 11 | 11 | 8 | 13 | 17 | 7 | 8 | 1 | 2 | 0 | 12 | 72 | 78 | 6 |
| 19–25 September 2016 | Ipsos | RTL TVi / Le Soir / VTM / Het Laatste Nieuws[15] | 24 | 18 | 11 | 19 | 13 | 10 | 10 | 11 | 19 | 6 | 5 | 2 | 2 | 0 | 5 | 72 | 78 | 6 |
| 6–12 May 2016 | Ipsos | RTL TVi / Le Soir / VTM / Het Laatste Nieuws[18] | 24 | 13 | 12 | 15 | 14 | 11 | 12 | 10 | 20 | 8 | 7 | 2 | 2 | 0 | 4 | 64 | 86 | 22 |
| 15–20 January 2016 | Ipsos | RTL TVi / Le Soir / VTM / Het Laatste Nieuws[22] | 28 | 14 | 12 | 19 | 14 | 9 | 9 | 6 | 21 | 8 | 7 | 1 | 2 | 0 | 7 | 73 | 77 | 4 |
| 25 May 2014 | Federal election | 33 | 18 | 14 | 20 | 13 | 6 | 3 | 2 | 23 | 9 | 6 | 1 | 2 | 0 | 10 | 85 | 65 | 20 | |
References
- 1 2 3 "Grand baromètre: la N-VA poursuit sa chute". Lesoir.be (in French). 4 October 2018.
- 1 2 3 "Grand Baromètre: trou d'air pour la N-VA, qui chute de 4,8%". Lesoir.be (in French). 8 June 2018.
- 1 2 "N-VA dubbel zo groot als eerste achtervolger CD&V, SP.A duikt onder de 10 procent". 27 March 2018.
- 1 2 "Socialisten stijgen, N-VA blijft pieken". 9 March 2018.
- ↑ "Grote Peiling: SP.A in vrije val in Vlaanderen". 8 December 2017.
- ↑ "Groen haalt beste resultaat ooit, N-VA blijft met voorsprong grootste partij". 8 September 2017.
- ↑ "De Grote Peiling: N-VA grootste met 30,2%". 8 September 2017.
- 1 2 3 "La fusée PTB dans la stratosphère, le Parti socialiste s'écrase totalement". 1 July 2017.
- ↑ "Groen wordt de derde partij in Vlaanderen, N-VA verliest". 19 April 2017.
- 1 2 3 "Baromètre RTBF-La Libre: le PS s'effondre, le PTB triomphe". 24 March 2017.
- 1 2 3 4 lesoir.be (24 January 2017). "Grand Baromètre: le PTB se félicite de son succès auprès des citoyens".
- 1 2 3 "Baromètre RTBF: le PTB toujours plus haut". 2 December 2016.
- 1 2 3 "Baromètre politique: Le PTB poursuit son envol". 2 December 2016.
- ↑ "Regeringspartijen verliezen, Groen gaat met CD&V-kiezers lopen". 10 October 2016.
- 1 2 3 4 Grand baromètre: hausse spectaculaire du PTB, 3e parti francophone, 29 September 2016
- 1 2 3 Baromètre RTBF-La Libre: le PTB wallon triomphe
- 1 2 3 "Baromètre: Le PTB s'envole en Wallonie au détriment du PS, le CDH historiquement bas à Bruxelles". 9 September 2016.
- 1 2 3 4 Grand baromètre politique: le PTB devient le 3e parti de Wallonie, 18 May 2016.
- 1 2 3 "Baromètre politique: les partis de la majorité fédérale chutent, le Vlaams Belang progresse". 8 April 2016.
- 1 2 3 "Baromètre politique: La N-VA en chute libre, le MR résiste". 8 April 2016.
- ↑ "Peiling maart 2016". 15 March 2016.
- 1 2 3 4 lesoir.be (25 January 2016). "Baromètre politique: le PS reprend de l'avance sur le MR en Wallonie".
- 1 2 "Baromètre RTBF-La Libre: le Vlaams Belang aspire des électeurs N-VA". 11 December 2015.
- 1 2 lesoir.be. "Grand baromètre: le recul du PS continue à Bruxelles".
- ↑ "Peiling najaar 2015". 9 October 2015.
- 1 2 3 4 "Baromètre: sale temps pour les majorités". 18 September 2015.
- ↑ "Meerderheid houdt stand, oppositie breekt niet door". 8 May 2015.
- 1 2 3 4 5 6 7 8 9 "Baromètre politique: la N-VA à nouveau en recul et le PS au plus bas". 13 March 2015.
- 1 2 3 4 lesoir.be. "Grand Baromètre: le PS boit la tasse".
- 1 2 "Qui sont les grands gagnants et grands perdants de notre baromètre politique ?". 27 March 2018.
- ↑ "Grand Baromètre: Ecolo progresse partout, le PS rebondit en Wallonie". 9 March 2018.
- 1 2 "Grand Baromètre: la Wallonie reste à gauche, PS et PTB prennent 40% des intentions de vote". 8 September 2017.
- 1 2 3 "DéFI devient le 2ème parti à Bruxelles, le cdH touche le fond partout". 7 September 2017.
- ↑ "Premier sondage exclusif depuis l'affaire Publifin: le PTB n'a jamais été aussi proche du PS et du MR!". sudinfo.be. 18 February 2017.
- ↑ "Grand Baromètre: à Bruxelles, le CDH atteint tout juste le seuil électoral". 9 March 2018.
- ↑ "Grote Peiling: N-VA blijft zakken, Groen behaalt beste score ooit". 4 October 2018.
- ↑ "De Grote Peiling: alle regeringspartijen verliezen zetels". 9 June 2018.
- ↑ "Une extrapolation en sièges du sondage @lesoir - @rtlinfo - IPSOS". Retrieved 10 December 2017.