Opinion polling for the Russian legislative election, 2016
In the run up to the 2016 Russian legislative election, various organisations carried out opinion polling to gauge voting intention in Russia. Results of such polls are displayed in this article.
The date range for these opinion polls are from the previous legislative election, held on 4 December 2011, to 11 September 2016.
Graphical summary
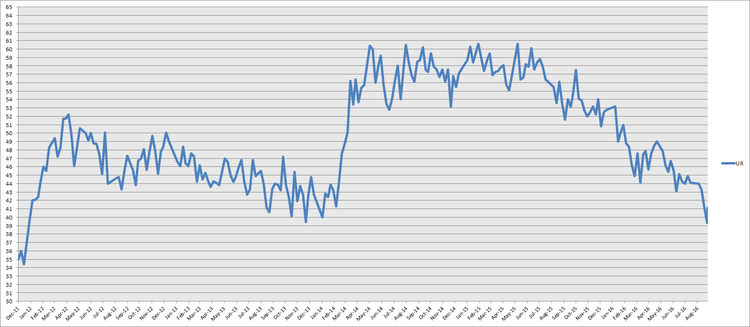

Party vote
Poll results are listed in the table below in reverse chronological order, showing the most recent first, and using the date the survey's fieldwork was done, as opposed to the date of publication. If that date is unknown, the date of publication is given instead. The highest percentage figure in each polling survey is displayed in bold, and the background shaded in the leading party's colour. If a tie occurs, then no figure is shaded. The lead column on the right shows the percentage-point difference between the two parties with the highest figures. When a specific poll does not show a data figure for a party, the party's cell corresponding to that poll is shown empty.
The table below represents mostly 2016 polls of Russian citizens (including voters who are undecided about which party they would vote for or are not sure whether they will actually vote, those saying they will not be voting, voters who have decided to spoil their ballots, supporters of any other party that is not on the list). Parties with more than 5% support (enough to enter State Duma) are given in bold. Throughout the campaign political analysts have predicted that only three or four parties will be elected to the Duma - UR, CPRF, LDPR, and JR.[1]
| Date | Poll source | UR | CPRF | LDPR | JR | PARNAS | Yabloko | CPl | Rodina | PoR | Greens | PoG[nb 1] | CoR | RPPJ | CPo | Lead |
|---|---|---|---|---|---|---|---|---|---|---|---|---|---|---|---|---|
| 18 September 2016 | 2016 result | 54.2% | 13.3% | 13.1% | 6.2% | 0.7% | 2.0% | 0.2% | 1.5% | 0.6% | 0.8% | 1.3% | 2.3% | 1.7% | 0.1% | 40.9% |
| 11 September 2016 | FOM | 43% | 8% | 11% | 5% | 1% | 1% | 0% | 1% | 0% | 0% | 1% | 0% | 1% | 0% | 32% |
| 11 September 2016 | WCIOM | 41.1% | 7.4% | 12.6% | 6.3% | 0.8% | 1.1% | 0.1% | 1.1% | 0.4% | 0.6% | 0.8% | 0.6% | 2.4% | 0.0% | 28.5% |
| 4 September 2016 | WCIOM | 39.3% | 8.7% | 10.4% | 5.3% | 0.4% | 1.1% | 0.2% | 0.8% | 0.2% | 0.5% | 0.8% | 0.4% | 1.6% | 0.0% | 28.9% |
| 4 September 2016 | FOM | 41% | 9% | 11% | 4% | 0% | 1% | 0% | 1% | 0% | 0% | 0% | 0% | 1% | 0% | 30% |
| 26-29 August 2016 | Levada Centre | 31% | 10% | 9% | 5% | 1% | 1% | <1% | 1% | <1% | 1% | <1% | 1% | 1% | <1% | 21% |
| 28 August 2016 | WCIOM | 41.2% | 7.7% | 12.2% | 5.4% | 0.4% | 1.3% | 0.4% | 0.9% | 0.4% | 0.3% | 0.6% | 0.4% | 1.9% | 0.2% | 29% |
| 28 August 2016 | FOM | 44% | 8% | 11% | 5% | 0% | 1% | 0% | 1% | 0% | 1% | 0% | 0% | 1% | 0% | 33% |
| 21 August 2016 | WCIOM | 43.3% | 8.4% | 10.8% | 6.6% | 0.6% | 0.9% | 0.2% | 0.6% | 0.2% | 0.2% | 0.8% | 0.4% | 1.4% | 0.0% | 32.5% |
| 21 August 2016 | FOM | 45% | 9% | 8% | 4% | 0% | 1% | 0% | 1% | 0% | 0% | 0% | 0% | 1% | 0% | 36% |
| 14 August 2016 | WCIOM | 44.0% | 10.1% | 11.8% | 7.5% | 0.3% | 1.0% | 0.0% | 0.3% | 0.2% | 0.2% | 0.6% | 0.3% | 0.9% | 0.2% | 32.2% |
| 14 August 2016 | FOM | 42% | 10% | 9% | 8% | <1% | 1% | <1% | <1% | 1% | <1% | <1% | <1% | <1% | <1% | 32% |
| 7 August 2016 | FOM | 45% | 10% | 8% | 8% | <1% | 1% | 1% | <1% | <1% | <1% | <1% | <1% | <1% | <1% | 35% |
| 31 July 2016 | FOM | 47% | 9% | 8% | 8% | <1% | <1% | 1% | <1% | <1% | – | <1% | <1% | <1% | <1% | 38% |
| 25 July 2016 | Levada Centre | 39% | 10% | 10% | 3% | 1% | 1% | <1% | <1% | <1% | <1% | <1% | 1% | <1% | <1% | 29% |
| 24 July 2016 | FOM | 44% | 10% | 11% | 7% | <1% | 1% | <1% | <1% | 1% | – | <1% | <1% | <1% | <1% | 33% |
| 24 July 2016 | WCIOM | 44.1% | 10.1% | 10.7% | 6.4% | 0.4% | 1.1% | 0.2% | 0.3% | 0.1% | 0.5% | 0.4% | 0.1% | 0.7% | 0.0% | 33.4% |
| 17 July 2016 | FOM | 45% | 10% | 12% | 7% | <1% | 1% | <1% | <1% | 1% | – | <1% | <1% | <1% | <1% | 33% |
| 17 July 2016 | WCIOM | 44.9% | 8.7% | 11.3% | 6.7% | 0.3% | 0.7% | 0.2% | 0.3% | 0.2% | 0.2% | 0.7% | 0.1% | 0.8% | 0.1% | 33.6% |
| 10 July 2016 | FOM | 46% | 10% | 12% | 6% | <1% | 1% | <1% | <1% | 1% | – | <1% | <1% | <1% | <1% | 34% |
| 10 July 2016 | WCIOM | 44% | 9.9% | 10.5% | 7.8% | 0.1% | 0.8% | 0.2% | 0.1% | 0.4% | 0.6% | 0.2% | 0.4% | 0.5% | 0.0% | 33.5% |
| 3 July 2016 | WCIOM | 44.3% | 10.4% | 9.0% | 7.9% | 0.5% | 0.8% | 0.3% | 0.4% | 0.3% | 0.3% | 0.4% | 0.2% | 0.6% | 0.0% | 33.9% |
| 3 July 2016 | FOM | 46% | 10% | 11% | 7% | <1% | 1% | <1% | <1% | 1% | – | <1% | <1% | <1% | <1% | 35% |
| 27 June 2016 | Levada Centre | 55.8% | 18.2% | 14.2% | 5.1% | – | – | – | – | – | – | – | – | – | – | 37.6% |
| 26 June 2016 | WCIOM | 45.1% | 9.4% | 10.1% | 6.5% | 0.4% | 1.1% | 0.3% | 0.3% | 0.6% | 0.2% | 0.5% | 0.7% | 0.4% | 0.0% | 35% |
| 26 June 2016 | FOM | 45% | 10% | 11% | 6% | <1% | 1% | 1% | <1% | <1% | – | <1% | <1% | <1% | <1% | 34% |
| 24 June 2016 | FBK | 39% | 6% | 5% | 4% | <1% | <1% | – | – | – | – | – | – | – | – | 33% |
| 19 June 2016 | WCIOM | 43.1% | 9.5% | 11.4% | 6.9% | 0.6% | 1% | 0.1% | 0.2% | 0.2% | 0.2% | 0.3% | 0.2% | 0.7% | 0.1% | 31.7% |
| 12 June 2016 | WCIOM | 45.5% | 8.9% | 9.7% | 6.8% | 0.1% | 1.2% | 0.3% | 0.4% | 0.3% | 0.5% | 0.3% | 0.4% | 0.6% | 0.1% | 35.8% |
| 5 June 2016 | FOM | 48% | 10% | 11% | 5% | <1% | 1% | <1% | <1% | 1% | – | <1% | <1% | <1% | <1% | 37% |
| 5 June 2016 | WCIOM | 46.7% | 10.3% | 10.1% | 5.1% | 0.3% | 0.8% | 0.4% | 0.2% | 0.5% | 0.6% | 0.2% | 0.4% | 0.5% | 0.1% | 36.4% |
| 29 May 2016 | WCIOM | 45.4% | 9.9% | 9.9% | 5.5% | 0.3% | 1.3% | 0.3% | 0.1% | 0.3% | 0.5% | 0.1% | 0.1% | 0.8% | 0.2% | 35.5% |
| 22 May 2016 | WCIOM | 46.2% | 9.3% | 11% | 5.9% | 0.3% | 1.2% | 0.2% | 0.1% | 0.5% | 0.5% | 0.2% | 0.3% | 0.5% | 0.1% | 35.2% |
| 15 May 2016 | WCIOM | 47.9% | 10.1% | 10.8% | 5.8% | 0.2% | 0.9% | 0.3% | 0.1% | 0.2% | 0.4% | 0.1% | 0.3% | 0.3% | 0.0% | 37.1% |
| 1 May 2016 | WCIOM | 49% | 10.7% | 10.5% | 6.4% | 0.4% | 1.1% | 0.1% | 0.3% | 0.1% | 0.5% | 0.4% | 0.3% | 0.8% | 0.2% | 38.3% |
| 24 April 2016 | WCIOM | 48.5% | 9.1% | 9.9% | 6.4% | 0.2% | 0.9% | 0.3% | 0.2% | 0.5% | 0.3% | 0.3% | 0.4% | 0.6% | 0.1% | 38.6% |
| 17 April 2016 | WCIOM | 47.6% | 10% | 9.2% | 5.6% | 0.4% | 1% | 0.1% | 0.4% | 0.5% | 0.5% | 0.4% | 0.6% | 0.9% | 0.1% | 37.6% |
| 10 April 2016 | FOM | 46% | 9% | 11% | 5% | 1% | 1% | 1% | <1% | 1% | – | <1% | <1% | <1% | <1% | 35% |
| 10 April 2016 | WCIOM | 45.7% | 10.3% | 10.6% | 6.6% | 0.3% | 1.5% | 0.6% | 0.4% | 0.2% | 0.5% | 0.3% | 0.2% | 1.0% | 0.0% | 35.1% |
| 3 April 2016 | WCIOM | 47.9% | 9% | 8.5% | 6.3% | 0.5% | 0.7% | 0.4% | 0.1% | 0.4% | 0.2% | 0.1% | 0.2% | 0.6% | 0.0% | 38.9% |
| 27 March 2016 | WCIOM | 47.5% | 9.1% | 9.3% | 5.4% | 0.4% | 1.7% | 0.3% | 0.4% | 0.5% | 0.3% | 0.2% | 0.3% | 1.0% | 0.3% | 38.2% |
| 20 March 2016 | WCIOM | 44.1% | 10.1% | 9.6% | 6.3% | 0.8% | 1.5% | 0.5% | 0.4% | 0.4% | 0.3% | 0.3% | 0.6% | 0.3% | 0.1% | 34% |
| February 2016 | WCIOM[nb 2] | 49% | 9% | 9% | 6% | – | – | – | – | – | – | – | – | – | – | 40% |
| 10 February 2016 | Levada Centre | 39% | 10% | 5% | 3% | <1% | 1% | 1% | 1% | 1% | <1% | – | – | – | – | 29% |
| January 2016 | WCIOM[nb 3] | 51% | 9% | 8% | 5% | – | – | – | – | – | – | – | – | – | – | 42% |
| December 2015 | WCIOM[nb 4] | 53% | 8% | 6% | 5% | – | – | – | – | – | – | – | – | – | – | 45% |
| 10 December 2015 | Levada Centre | 44% | 10% | 5% | 2% | <1% | 1% | 1% | 1% | 1% | 1% | – | – | – | – | 34% |
| November 2015 | WCIOM[nb 5] | 53% | 8% | 7% | 5% | – | – | – | – | – | – | – | – | – | – | 45% |
| October 2015 | WCIOM[nb 6] | 55% | 8% | 6% | 5% | – | – | – | – | – | – | – | – | – | – | 47% |
| 5 October 2015 | Levada Centre | 40% | 11% | 6% | 3% | 1% | 1% | 1% | 1% | 1% | 1% | – | – | – | – | 31% |
| September 2015 | WCIOM[nb 7] | 53% | 8% | 7% | 5% | – | – | – | – | – | – | – | – | – | – | 45% |
| 7 September 2015 | Levada Centre | 43% | 11% | 5% | 3% | 1% | 1% | 1% | 1% | 1% | 2% | – | – | – | – | 32% |
| 4 December 2011 | 2011 Result | 49.32% | 19.19% | 11.67% | 13.24% | — | 3.43% | — | — | 0.97% | — | 0.60% | — | — | — | 30.13% |
Notes
References
- ↑ "Политтехнологи дали новый прогноз по числу проходящих в Госдуму партий". Retrieved 7 September 2016.