List of countries by oil production
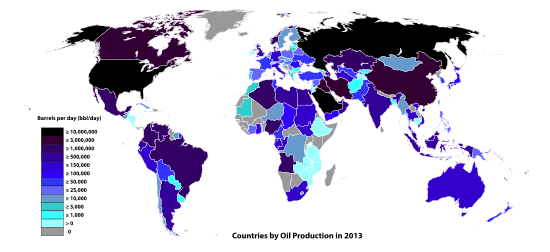
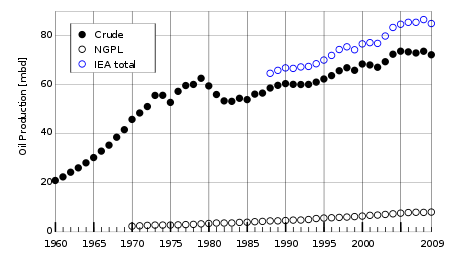
This is a list of countries by oil production, as compiled from the U.S. Energy Information Administration database for calendar year 2016, tabulating all countries on a comparable best-estimate basis. Compared with shorter-term data, the full-year figures are less prone to distortion from periodic maintenance shutdowns and other seasonal cycles. The volumes in the table represent crude oil and lease condensate, the hydrocarbon liquids collected at or near the wellhead. The volumes in the table do not include biofuel. They also do not include the increase in liquid volumes during oil refining ("refinery gain"), or liquids separated from natural gas in gas processing plants (natural gas liquids).[1]
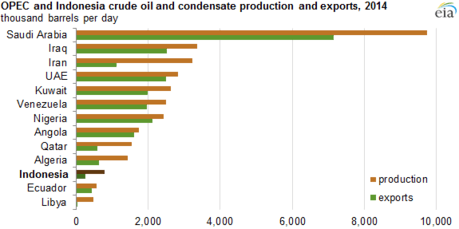
Under this definition, total world oil production in 2016 averaged 80,622,000 barrels per day. Approximately 68% came from the top ten countries, and an overlapping 44% came from the fourteen current OPEC members, highlighted with blue shading in the table below.
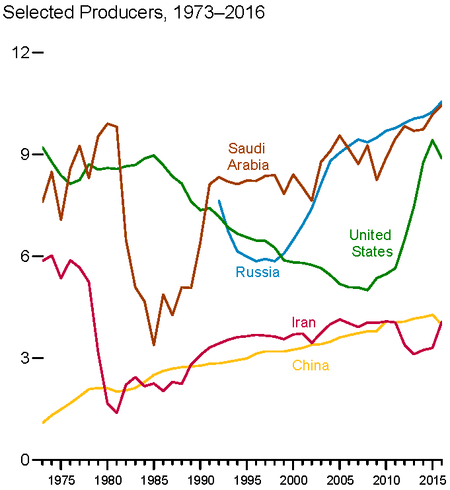
The top three producers have in recent history been (alphabetically) Russia, Saudi Arabia, and the United States. Each of these countries experienced major production declines at different times in the past, but since 2014 all three have been producing near their peak rates of 9 to 11 million barrels per day.[2] Saudi Arabia and Russia also top the list of oil exporting countries, while Russia is not a member of OPEC. The monthly U.S. oil production reached 10.07 million b/d in November 2017, the highest monthly level of crude oil production in U.S. history.[3] In early 2018, the U.S. government forecast the country will become a net oil and gas exporter by 2022, the first time since 1953.[4]
| Country | Oil Production (bbl/day, 2016)[1] |
Oil Production per capita (bbl/day/ million people, 2016)[5] | |
|---|---|---|---|
| - | World Production | 80,622,000 | 10,798 |
| 01 | 10,551,497 | 73,292 | |
| 02 | 10,460,710 | 324,866 | |
| 03 | 8,875,817 | 27,549 | |
| 04 | 4,451,516 | 119,664 | |
| 05 | 3,990,956 | 49,714 | |
| 06 | 3,980,650 | 2,836 | |
| 07 | 3,662,694 | 100,931 | |
| 08 | 3,106,077 | 335,103 | |
| 09 | 2,923,825 | 721,575 | |
| 10 | 2,515,459 | 12,113 | |
| 11 | 2,276,967 | 69,914 | |
| 12 | 2,186,877 | 17,142 | |
| 13 | 1,999,885 | 10,752 | |
| 14 | 1,769,615 | 61,417 | |
| 15 | 1,647,975 | 313,661 | |
| 16 | 1,595,199 | 88,686 | |
| 17 | 1,522,902 | 592,799 | |
| 18 | 1,348,361 | 33,205 | |
| 19 | 1,006,841 | 217,178 | |
| 20 | 1,003,000 | 159,383 | |
| 21 | 939,760 | 14,284 | |
| 22 | 897,784 | 18,452 | |
| 22 | 833,667 | 3,192 | |
| 23 | 833,538 | 85,710 | |
| 24 | 734,180 | 554 | |
| 25 | 661,240 | 21,202 | |
| 26 | 548,421 | 33,470 | |
| 27 | 510,560 | 11,644 | |
| 28 | 504,000 | 25,469 | |
| 29 | 494,325 | 5,166 | |
| 31 | 308,363 | 60,168 | |
| 32 | 301,850 | 3,194 | |
| 33 | 289,749 | 12,010 | |
| 34 | 257,525 | 3,667 | |
| 35 | 255,000 | 4,932 | |
| 36 | 230,779 | 40,759 | |
| 37 | 227,000 | 125,068 | |
| 38 | 210,820 | 106,528 | |
| 39 | 140,637 | 24,369 | |
| 40 | 110,156 | 7,393 | |
| 41 | 109,117 | 257,959 | |
| 42 | 100,549 | 3,564 | |
| 43 | 93,205 | 3,983 | |
| 44 | 84,746 | 438 | |
| 45 | 70,675 | 1,189 | |
| 46 | 60,661 | 47,839 | |
| 47 | 60,090 | 44,054 | |
| 48 | 58,077 | 5,334 | |
| 49 | 56,667 | 7,013 | |
| 50 | 52,913 | 1,682 | |
| 51.5 | 50,000 | 35,087 | |
| 51.5 | 50,000 | 4,357 | |
| 53 | 49,497 | 622 | |
| 54 | 48,757 | 4,275 | |
| 55 | 46,839 | 571 | |
| 56 | 40,266 | 1,267 | |
| 57 | 35,574 | 7,633 | |
| 58 | 31,989 | 720 | |
| 59.5 | 30,000 | 1,265 | |
| 59.5 | 30,000 | 1,627 | |
| 61 | 25,000 | 2,637 | |
| 62 | 23,426 | 7,739 | |
| 63 | 22,915 | 7,901 | |
| 64 | 22,000 | 797 | |
| 65 | 20,104 | 525 | |
| 67 | 20,000 | 254 | |
| 67 | 20,000 | 193 | |
| 67 | 20,000 | 2,272 | |
| 69 | 18,087 | 1,070 | |
| 70 | 17,000 | 30,465 | |
| 71 | 16,418 | 253 | |
| 72 | 15,161 | 1,742 | |
| 73 | 15,000 | 284 | |
| 74 | 13,833 | 1,426 | |
| 75 | 13,582 | 3,223 | |
| 76 | 13,000 | 631 | |
| 77 | 8,977 | 544 | |
| 78 | 5,000 | 1,162 | |
| 79 | 4,423 | 247 | |
| 80 | 4,189 | 25 | |
| 81 | 3,918 | 30 | |
| 82 | 3,172 | 285 | |
| 83 | 2,667 | 57 | |
| 84 | 2,333 | 220 | |
| 86 | 2,000 | 5,464 | |
| 86 | 2,000 | 689 | |
| 86 | 2,000 | 35 | |
| 89 | 1,000 | 3,521 | |
| 89 | 1,000 | 140 | |
| 89 | 1,000 | 169 | |
| 91 | 400 | 102 | |
| 92 | 390 | 47 | |
| 93 | 200 | 37 | |
| 94 | 196 | 8 | |
| 95 | 180 | 20 | |
| 96 | 160 | 4 | |
| 97 | 22 | 2 | |
| 98 | 5 | 2 |
References
- 1 2 "Production of Crude Oil including Lease Condensate 2016" (CVS download). U.S. Energy Information Administration. Retrieved 27 May 2017.
- 1 2 "Monthly Energy Review" (PDF). U.S. Energy Information Administration. 25 May 2017. Figure 11.1a. Retrieved 28 May 2017.
- ↑ U.S. production of crude oil grew 5% in 2017, likely leading to record 2018 production U.S. Energy Information Administration, 4 April 2018.
- ↑ US will be a net energy exporter by 2022, four years sooner than expected, Energy Department says CNBC, 7 February 2018.
- 1 2 "Total Population - Both Sexes". World Population Prospects, the 2017 Revision. United Nations Department of Economic and Social Affairs, Population Division, Population Estimates and Projections Section. June 2017. Retrieved 22 June 2017.