Nolan Chart
The Nolan Chart is a political spectrum diagram created by American libertarian activist David Nolan in 1969. The chart divides human political views into two vectors—economic opinion and personal opinion—to produce a type of Cartesian chart. It expands political view analysis beyond the traditional left–right line, which measures politics along a one-dimensional line, into a graph with two dimensions: degrees of economic freedom and personal freedom.
Development

The claim that political positions can be located on a chart with two axes: left-right (economics) and tough-tender (authoritarian-libertarian) was put forward by the British psychologist Hans Eysenck in his 1954 book The Psychology of Politics with statistical evidence based on survey data.[1] This leads to a loose classification of political positions into four quadrants, with further detail based on exact position within the quadrant.[2]
A similar two-dimensional chart appeared in 1970 in the publication The Floodgates of Anarchy by Stuart Christie and Albert Meltzer, but that work distinguished between the axes collectivism–capitalism on the one hand, individualism–totalitarianism on the other, with anarchism, fascism, "state communism" and "capitalist individualism" in the corners.[3] In Radicals for Capitalism (p. 321), Brian Doherty attributes the idea for the chart to an article by Maurice Bryson and William McDill in The Rampart Journal of Individualist Thought (Summer 1968) entitled "The Political Spectrum: A Bi-Dimensional Approach".[4]
David Nolan first published his version of the chart in an article named "Classifying and Analyzing Politico-Economic Systems" in the January 1971 issue of The Individualist, the monthly magazine of the Society for Individual Liberty (SIL). In December 1971, he helped to start the group that would become the Libertarian Party.[5]
Frustrated by the "left-right" line analysis that leaves no room for other ideologies, Nolan devised a chart with two axes which would come to be known as the Nolan Chart, and later became the centerpiece of the World's Smallest Political Quiz. Nolan's argument was that the major difference between various political philosophies, the real defining element in what a person believes politically, is the amount of government control over human action that is advocated.[6] Nolan further reasoned that virtually all human political action can be divided into two broad categories: economic and personal. The "economic" category includes what people do as producers and consumers – what they can buy, sell and produce, where they work, who they hire and what they do with their money. Examples of economic activity include starting or operating a business, buying a home, constructing a building and working in an office. The "personal" category includes what people do in relationships, in self-expression and what they do with their own bodies and minds. Examples of personal activities include whom they marry; choosing what books they read and movies they watch; what foods, medicines and drugs they choose to consume; recreational activities; religious choices; organizations they join; and with whom they choose to associate.
According to Nolan, since most government activity (or government control) occurs in these two major areas, political positions can be defined by how much government control a person or political party favors in these two areas. The extremes are no government at all in either area (anarchism) or total or near-total government control of everything (various forms of totalitarianism). Most political philosophies fall somewhere in between. In broad terms:
- Those on the right, including American conservatives, tend to favor more freedom in economic matters (example: a free market), but more government intervention in personal matters (example: drug laws).
- Those on the left, including American liberals, tend to favor more freedom in personal matters (example: no military draft), but more government activism or control in economics (example: a government-mandated minimum wage).
- Libertarians favor both personal and economic freedom and oppose most (or all) government intervention in both areas. Like conservatives, libertarians believe in free markets. Like liberals, libertarians believe in personal freedom.
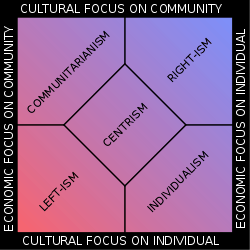
- Statists favor a lot of government control in both the personal and economic areas. Different versions of the chart as well as Nolan's original chart use terms such as "totalitarian", "authoritarian", "communitarian" or "populist" to label this corner of the chart.
In order to visually express this argument, Nolan came up with a two-axis graph. One axis was for economic freedom and the other was for personal freedom, with the scale on each of the two axes ranging from zero (total state control) to 100% (no state control). 100% freedom in economics would mean an entirely free market (laissez-faire); 100% freedom in personal issues would mean no government control of private, personal life. By using the scale on each of the two axes, it was possible to graph the intersection of the amount of personal liberty and economic liberty a person, political organization, or political philosophy advocates. Therefore, instead of classifying all political opinion on a one-dimensional range from left to right, Nolan's chart allowed two-dimensional measurement: how much (or little) government control a person favored in personal and economic matters.
Nolan said that one of the impacts of his chart is that when someone views it, it causes an irreversible change as viewers henceforth view the included orientations in two dimensions instead of one.[7]
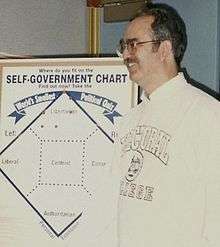
In 1987, Marshall Fritz, founder of Advocates for Self-Government, tweaked the chart and added ten questions – which he called the World's Smallest Political Quiz – which enabled people to plot their political beliefs on the chart.
Positions

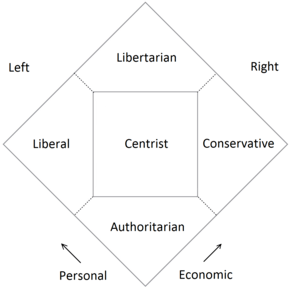
Differing from the traditional left–right distinction and other political taxonomies, the Nolan Chart in its original form has two dimensions, with a horizontal x-axis labeled "economic freedom" and a vertical y-axis labeled "personal freedom". It resembles a square divided into five sections, with a label assigned to each of the following sections:
- Bottom left – Statism. The opposite of libertarianism, corresponding with those supporting low economic and personal freedom. David Nolan originally termed this philosophy populism, but many later renditions of the chart have used the label statism[8], authoritarianism, totalitarianism or fascism instead.[9][10][11]
- Top left – Left-wing political philosophies. Those supporting low economic freedom and high personal freedom.
- Bottom right – Right-wing political philosophies. Those supporting high economic freedom and low personal freedom.
- Top right – Libertarians. David Nolan's own philosophy, corresponding with those supporting high economic and personal freedom.
- Center – Centrism. The center area defines the political middle, for those who favor a mixed system balancing both economic and personal freedom with the need for some market regulation and personal sacrifice.
Polling
In August 2011, the libertarian Reason magazine worked with the Rupe organization to survey 1,200 Americans by telephone and place their views within the Nolan chart categories. The Reason-Rupe poll found that "Americans cannot easily be bundled into either the 'liberal' or 'conservative' groups". Specifically, 28% expressed conservative views, 24% expressed libertarian views, 20% expressed communitarian views and 28% expressed liberal views. The margin of error was ±3.[12]
Criticism
The Nolan chart is problematic to those who equate economic regulation with personal freedom and because the libertarian definition of freedom is different from the leftist definition. In his book Eight Ways to Run the Country: A New and Revealing Look at the Left and the Right, Brian Patrick Mitchell gives three reasons for the perception that the chart has a libertarian bias. First, the chart shows no division between the personal and the economic. Second, personal freedoms are defined from different perspectives by the right and the left. Third, "the chart is based on a Libertarian definition of freedom not accepted by most Liberals". [13]
See also
References
- ↑ Hans Eysenck. The Psychology of Politics. 1954.
- ↑ David Claborn & Lindsey Tobias. "If You Can't Join 'Em, Don't : Untangling Attitudes on Social, Economic and Foreign Issues by Graphing Them". Olivet Nazarene University. Retrieved May 15, 2015.
- ↑ Christie, Stuart, Albert Meltzer. The Floodgates of Anarchy. Kahn & Averill. London. 1970. p. 73. ISBN 978-0-900707-03-2.
- ↑ Maurice Bryson, William McDill (Summer 1968). "The Political Spectrum: A Bi-Dimensional Approach" (PDF). The Rampart Journal of Individualist Thought.
- ↑ "David Nolan – Libertarian Celebrity". Advocates for Self Government. Archived from the original on June 16, 2008. Retrieved September 9, 2008.
- ↑ https://www.theadvocates.org/about-the-quiz/
- ↑ "Mark Selzer and co-host Martina Slocomb interview David Nolan". The Libertarian Alternative Public Access TV Show. Retrieved February 15, 2013.
- ↑ https://www.merriam-webster.com/dictionary/statism
- ↑ "The ORIGINAL and Acclaimed Internet Political Quiz!". Advocates For Self-Government. Retrieved June 4, 2018.
- ↑ "What is a Statist?". Nolan Chart - Online Marketing Guild LLC. Retrieved June 4, 2018.
- ↑ William M. Briggs (April 24, 2010). "The Pournelle vs. Nolan Chart: Political Throwdown". W.M. Briggs. Retrieved June 4, 2018.
- ↑ Emily Ekins (August 29, 2011). "Reason-Rupe Poll Finds 24 Percent of Americans are Economically Conservative and Socially Liberal, 28 Percent Liberal, 28 Percent Conservative, and 20 Percent Communitarian". Reason. Retrieved January 1, 2012.
- ↑ Brian Patrick Mitchell (2007). Eight Ways to Run the Country: A New and Revealing Look at Left and Right. Greenwood Publishing Group. p. 7. ISBN 978-0-275-99358-0.
Further reading
- Bryson, Maurice C.; McDill, William R. (Summer 1968). "The Political Spectrum: A Bi-Dimensional Approach" (PDF). Rampart Journal of Individualist Thought. Larkspur, CO: Rampart College. IV: 19–26.
External links

- A modern version of the Nolan Chart
- Nolan Chart website
- The Nolan Chart and its variations
- Positive & Negative Liberties in Three Dimensions
- The Enhanced Precision Political Quiz... IN 2D
- Political Profile Test
- Political Spectrum Quiz
- A voting index of the U.S. Congress (prepared by Prof. Clifford F. Thies for the Republican Liberty Caucus)