Multi Router Traffic Grapher
|
| |
| Developer(s) | Tobi Oetiker |
|---|---|
| Stable release |
2.17.7
/ July 13, 2018[1] |
| Written in | Perl |
| Operating system | Cross-platform |
| Type | Bandwidth monitor |
| License | GNU General Public License |
| Website |
oss |
The Multi Router Traffic Grapher (MRTG) is free software for monitoring and measuring the traffic load on network links. It allows the user to see traffic load on a network over time in graphical form.
It was originally developed by Tobias Oetiker and Dave Rand to monitor router traffic, but has developed into a tool that can create graphs and statistics for almost anything.
MRTG is written in Perl and can run on Windows, Linux, Unix, Mac OS and NetWare.
How it works
SNMP
MRTG uses the Simple Network Management Protocol (SNMP) to send requests with two object identifiers (OIDs) to a device. The device, which must be SNMP-enabled, will have a management information base (MIB) to look up the OIDs specified. After collecting the information it will send back the raw data encapsulated in an SNMP protocol. MRTG records this data in a log on the client along with previously recorded data for the device. The software then creates an HTML document from the logs, containing a list of graphs detailing traffic for the selected devices in the server.
Script output
Alternatively, MRTG can be configured to run a script or command, and parse its output for counter values. The MRTG website contains a large library of external scripts to enable monitoring of SQL database statistics, firewall rules, CPU fan RPMs, or virtually any integer-value data.
Features
- Measures two values (I for Input, O for Output) per target.
- Gets its data via an SNMP agent, or through the output of a command line.
- Typically collects data every five minutes (it can be configured to collect data less frequently).
- Creates an HTML page per target that features four graphs (GIF or PNG images).
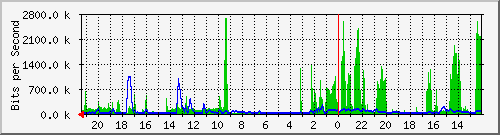
- Results are plotted vs time into day, week, month and year graphs, with the I plotted as a full green area, and the O as a blue line.
- Automatically scales the Y axis of the graphs to show the most detail.
- Adds calculated Max, Average and Current values for both I and O to the target's HTML page.
- Can also send warning emails if targets have values above a certain threshold.
See also
References
- ↑ "Index of /mrtg/pub". Retrieved 2013-01-12.
External links
- MRTG Home page
- "MRTG". Freecode.
- Helpful page with example MRTG grabs and explanations.
- Solaris PME
- Red Hat Enterprise Linux MRTG Configuration HOW-TO
- MRTGEXT module for supporting MRTG and Nagios monitoring systems on Novell Servers project
- Trend View a MRTG Frontend for Windows
- MRTG-XTRA, a Windows distribution of MRTG --DISCONTINUED--