Mount Carmel Area School District
- For other schools with the same name, see Mount Carmel High School (disambiguation).
| Mount Carmel Area School District | |
|---|---|
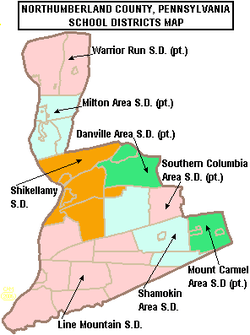 Shows a portion of Mount Carmel ASD | |
| Address | |
|
600 West 5th Street Mount Carmel, Northumberland County, Columbia County, Pennsylvania 17851 United States | |
| Information | |
| Type | Public |
| School board | 9 elected members |
| Superintendent | Bernard Stellar salary $66,096 (2013) contract renewed 3 years salary $99,849.56. (2017) |
| Administrator |
Mrs. Monica McKerns-O'Donnell director of special ed |
| Director | Mr. Gregory Scavage, Athletics Director, salary $60,843[1] |
| Principal |
Ms. Susan Nestico ES Salary $63,654 (2015) $68,000 (2017) |
| Principal | Mrs. Lisa Varano HS |
| Principal | Pete Cheddar, JHS |
| Staff | 101 nonteaching staff members in 2011 |
| Faculty | 105 teachers (2015),[3] 105 teachers (2012), 107 (2010)[4] |
| Grades | PreK-12 |
| Age | 4 years old to 21 years old special education |
| Number of pupils |
1520 pupils (2016-17)[5] |
| • Kindergarten | 123 (2015), 130 (2014),[8] 130 (2012), 187 (2010) |
| • Grade 1 | 131 (2015), 157 (2012), 99 |
| • Grade 2 | 120 (2015), 127 (2012), 119 |
| • Grade 3 | 111 (2015), 103 (2012), 96 |
| • Grade 4 | 132 (2015), 91 (2012), 115 |
| • Grade 5 | 115 (2015), 122 (2012), 141 |
| • Grade 6 | 98 (2015), 101 (2012), 101 |
| • Grade 7 | 99 (2015), 133 (2012), 92 |
| • Grade 8 | 124 (2015), 120 (2012), 125 |
| • Grade 9 | 96 (2015), 108 (2012), 142 |
| • Grade 10 | 119 (2015), 98 (2012), 120 |
| • Grade 11 | 114 (2015), 119 (2012), 144 |
| • Grade 12 | 98 (2015), 136 (2012), 113 (2010) |
| • Grade 13 | 40 preschool |
| • Other | Enrollment declining to 1,568 pupils by 2019[9] |
| Color(s) | Red and White |
| Mascot | Red Tornadoes |
| Rival | Shamokin |
| Budget |
$19,722,099.22 (2017-18)[10] |
| Per pupil Spending | $10,861.41 (2010) |
| Per pupil Spending | $9,126 (2008) |
| Website | http://www.mca.k12.pa.us/ |

Mount Carmel Area School District is a small, suburban, public school district in Northumberland County, Pennsylvania. The district is one of the 500 public school districts of Pennsylvania. It serves Mount Carmel, Kulpmont, Marion Heights, and Mount Carmel Township in Northumberland County, as well as the borough of Centralia in Columbia County. The Mount Carmel Area School District encompasses approximately 24 square miles (62 km2). According to 2000 local census data, it served a resident population of 12,815. By 2010, the district's population declined to 12,555 people.[13] The educational attainment levels for the School District population (25 years old and over) were 85.3% high school graduates and 14.3% college graduates.[14]
According to the Pennsylvania Budget and Policy Center, 69.2% of the district’s pupils lived at 185% or below the Federal Poverty level as shown by their eligibility for the federal free or reduced price school meal programs in 2012.[15] In 2009, Mount Carmel Area School District residents' per capita income was $15,294, while the median family income was $35,239.[16] In Northumberland County, the median household income was $38,397.[17] In the Commonwealth, the median family income was $49,501[18] and the United States median family income was $49,445, in 2010.[19] By 2013, the median household income in the United States rose to $52,100.[20]
Per school district officials, in school year 2007–08, the Mount Carmel Area School District provided basic educational services to 1,695 pupils through the employment of 120 teachers, 136 full-time and part-time support personnel, and 4 administrators. Mount Carmel Area School District received more than $10.9 million in state funding, for school year 2007–08. In school year 2009–10, Mount Carmel Area School District had 1,595 pupils. The district employed: 120 teachers, 136 full-time and part-time support personnel, and 4 administrators.[21]
Mount Carmel Area School District operates three schools: Mount Carmel Area Elementary School, Mount Carmel Area Junior High School and Mount Carmel Area High School. The district also provides taxpayer funded, full-day preschool for 4 year olds. In 2015, more than 51 Mount Carmel Area pupils attend full-time cyber school.[22] The District does not offer its own cyber school program. The pupils attend any of the 13 cyber schools operating in Pennsylvania in 2015, including locally operated SusQ Cyber Charter School.[23]
Mount Carmel Area High School students may choose to attend Northumberland County Career Technology Center for training in the building trades, culinary arts and cosmetology as well as other careers. The Central Susquehanna Intermediate Unit CSIU16 provides the district with a wide variety of services like specialized education for disabled students and hearing, speech and visual disability services and professional development for staff and faculty.
Governance
Mount Carmel Area School District is governed by 9 individually elected board members (serve four-year terms), the Pennsylvania State Board of Education, the Pennsylvania Department of Education and the Pennsylvania General Assembly.[24] The federal government controls programs it funds like Title I funding for low-income children in the Elementary and Secondary Education Act and the No Child Left Behind Act, which mandates the district focus resources on student success in acquiring reading and math skills. The superintendent and business manager are appointed by the school board. The superintendent is the chief administrative officer with overall responsibility for all aspects of operations, including education and finance. The business manager is responsible for budget and financial operations. Neither of these officials are voting members of the school board. The school board enters into individual employment contracts for these positions. In Pennsylvania, public school districts are required to give 150 days notice to the superintendent regarding renewal of the employment contract.
The Commonwealth Foundation for Public Policy Alternatives Sunshine Review gave the school board and district administration a "F" for transparency based on a review of "What information can people find on their school district's website". It examined the school district's website for information regarding; taxes, the current budget, meetings, school board members names and terms, contracts, audits, public records information and more.[25]
Academic achievement
In 2016, Mount Carmel Area School District ranked 416th out of 496 Pennsylvania public school districts, by the Pittsburgh Business Times.[26] The ranking is based on the last 3 years of student academic achievement as demonstrated by PSSAs results in: reading, writing, math and science and the three Keystone Exams (literature, Algebra 1, Biology I) in high school.[27] Three school districts were excluded because they do not operate high schools (Saint Clair Area School District, Midland Borough School District, Duquesne City School District). The PSSAs are given to all children in grades 3rd through 8th. Adapted PSSA examinations are given to children in the special education programs. Writing exams were given to children in 5th and 8th grades.
- 2015 - 404th[28]
- 2014 – 380th[29]
- 2013 – 323rd[30]
- 2012 – 261st[31]
- 2011 – 309th[32]
- 2010 – 371st[33]
- 2009 – 365th
- 2008 – 315th
- 2007 – 328th out of 501 Pennsylvania school districts.[34]
- Opportunity Scholarship Tax Credit Program
In 2015 and 2016, Mount Carmel Area High School remained on the lowest academic achievement school list in the Commonwealth.[35] In 2014, the Pennsylvania Department of Education (PDE) released a report identifying one Mount Carmel Area School District school as among the lowest achieving schools for reading and mathematics in 2013.[36] Mount Carmel Area High School was among the 15% lowest achieving schools in the Commonwealth. Parents and students may be eligible for scholarships to transfer to another public or nonpublic school through the state's Opportunity Scholarship Tax Credit Program passed in June 2012.[37][38] The scholarships are limited to those students whose family's income is less than $60,000 annually, with another $12,000 allowed per dependent. Maximum scholarship award is $8,500, with special education students receiving up to $15,000 for a year's tuition. Parents pay any difference between the scholarship amount and the receiving school's tuition rate. Students may seek admission to neighboring public school districts. Each year the PDE publishes the tuition rate for each individual public school district.[39] Fifty-three public schools in Allegheny County are among the lowest-achieving schools in 2011. According to the report, parents in 414 public schools (74 school districts) were offered access to these scholarships. For the 2012–13 school year, eight public school districts in Pennsylvania had all of their schools placed on the list including: Sto-Rox School District, Chester Upland School District, Clairton City School District, Duquesne City School District, Farrell Area School District, Wilkinsburg Borough School District, William Penn School District and Steelton-Highspire School District.[40] Funding for the scholarships comes from donations by businesses which receive a state tax credit for donating.
In October 2015, Pennsylvania Auditor General DiPasquale reported that Mount Carmel Area High School is among the 561 academically challenged schools that have been overlooked by the Pennsylvania Department of Education.[41][42] He also reported the Pennsylvania Department of Education failed to take any action to remediate the state's poorly performing schools to raise student academic achievement or to provide them with targeted professional assistance.[43]
District AYP status history
In 2012, Mount Carmel Area School District declined to Warning Adequate Yearly Progress (AYP) status due to lagging student achievement.[44] In 2011, Mount Carmel Area School District achieved Adequate Yearly Progress (AYP). In 2011, 94 percent of the 500 Pennsylvania public school districts achieved the No Child Left Behind Act progress level of 72% of students reading on grade level and 67% of students demonstrating on grade level math skills. In 2011, 46.9 percent of Pennsylvania school districts achieved Adequate Yearly Progress (AYP) based on student performance. An additional 37.8 percent of school districts made AYP based on a calculated method called safe harbor, 8.2 percent on the growth model and 0.8 percent on a two-year average performance.[45] Mount Carmel Area School District achieved AYP status each year from 2004 to 2009, while in 2003, Mount Carmel Area School District was in Warning status due to lagging student achievement.[46]
Graduation rate
In 2016, Mount Carmel Area School District's graduation rate declined to 83.51%.[47]
- 2015 - 87.39%[48]
- 2014 – 88%.[49]
- 2013 – 87.93%.[50]
- 2012 – 87%.[51]
- 2011 – 94%.
- 2010 – 76.26%, the Pennsylvania Department of Education issued a new, 4-year cohort graduation rate[52]
Former formula AYP graduation rate:
High school
Mount Carmel Area High School is located at 600 West 5th Street, Mount Carmel. In 2016, enrollment declined to 420 pupils in 9th through 12th grades, with 55% of pupils eligible for a free lunch due to the family meeting the federal federal poverty level. Additionally, 12.6% of pupils received special education services, while none of the pupils were identified as gifted.[57] The school employed 39 teachers.[58] Per the PA Department of Education, 100% of the teachers were rated "Highly Qualified" under the federal No Child Left Behind Act.[59]
In 2013, enrollment has declined to 461 pupils in 9th through 12th grades, with 48.59% of pupils eligible for a federal free or reduced-price lunch due to the family meeting the federal poverty level. Additionally, 18.65% of pupils receiving special education services, while 3.6% of pupils were identified as gifted. The school employed 41 teachers.[60] Per the PA Department of Education, 100% of the teachers were rated "Highly Qualified" under the federal No Child Left Behind Act.
According to the National Center for Education Statistics, in 2010, Mount Carmel Area High School reported an enrollment of 499 pupils in grades 9th through 12th, with 211 pupils eligible for a federal free or reduced-price lunch. The school employed 50 teachers, yielding a student–teacher ratio of 10:1.[61] According to a report by the Pennsylvania Department of Education, 2 teachers were rated "Non‐Highly Qualified" under No Child Left Behind.[62]
2016 School Performance Profile
School Performance Profile 69.2 out of 100 points. Mount Carmel Area High School Keystone Exams mandated testing results were: 73% of students were on grade level in reading-literature and 65% of students demonstrated on grade level in Algebra I. In Biology I, just 53% of pupils demonstrated on grade level science understanding at the end of the Biology course.[63] The requirement that pupils pass the Keystone Exams in reading, algebra I and bIology I in order to graduate was postponed until 2019 by the Pennsylvania General Assembly because less than 60% of 12 grade pupils statewide would have been eligible for graduation from high school due to failing one or more Keystone Exams.[64] Fifty-four percent of the 2,676 public schools in Pennsylvania achieved a passing score of 70 or better.[65]
2015 School Performance Profile
Mount Carmel Area High School achieved 57.5 out of 100. Reflects on grade level reading, mathematics and science achievement. The PDE reported that only 65.9% of the High School’s students were on grade level in reading/literature. In Algebra 1, 59.79% of students showed on grade level skills at the end of the course. In Biology I, 53.6% demonstrated on grade level science understanding at the end of the course.[66] Statewide, 53 percent of schools with an eleventh grade achieved an academic score of 70 or better. Five percent of the 2,033 schools with 11th grade were scored at 90 and above; 20 percent were scored between 80 and 89; 28 percent between 70 and 79; 25 percent between 60 and 69 and 22 percent below 60. The Keystone Exam results showed: 73 percent of students statewide scored at grade-level in English, 64 percent in Algebra I and 59 percent in biology.[67][68]
2014 School Performance Profile
Mount Carmel Area High School achieved 60.6 out of 100. Reflects on grade level reading, mathematics and science achievement. In reading/literature – 66.6% were on grade level. In Algebra 1, just 63% showed on grade level skills. In Biology, 51% demonstrated on grade level science understanding at the end of the course.[69][70] Among the high schools in the IU16 region, Mount Carmel's achievement ranked 15th out of 16.[71]
According to the Pennsylvania Department of Education, 2,134 of 2,947 Pennsylvania public schools (72 percent of Pennsylvania public schools), achieved an academic score of 70 or higher.[72] Fifty-three percent of schools statewide received lower SPP scores compared with last year's, while 46 percent improved. A handful were unchanged.[73][74]
Compared with last year, the percentage of schools that earned below 60 declined by nearly 1 percent per Secretayr of Education Carolyn Dumaresq. She reported that this is an indication that student achievement is improving as school resources are being used better.[75]
2013 School Performance Profile
Mount Carmel Area High School achieved 56.5 out of 100. Reflects on grade level reading, mathematics and science achievement. In reading/literature – just 68% of pupils were on grade level. In Algebra 1, only 55.66% demonstrated on grade level skills math skills. In Biology, just 37.38% showed on grade level science understanding.[76] According to the Pennsylvania Department of Education, 2,181 public schools (less than 73 percent of Pennsylvania public schools), achieved an academic score of 70 or higher. Pennsylvania 11th grade students no longer take the PSSAs. Instead, they now take the Keystone Exams at the end of the associated course.[77]
Adequate Yearly Progress history
In 2012, Mount Carmel Area High School declined to Warning AYP status due to missing all academic metrics.[78] In 2010 and 2011, Mount Carmel Area High School achieved AYP status.[79]
- 2010 – Making Progress School Improvement 1[80]
- 2009 – declined to School Improvement 1 due to low student academic achievement[81]
- 2008 – declined to Warning AYP status[82]
- 2007 – Achieved AYP status[83]
- 2006 – declined to Warning AYP status[84]
- 2005 – Achieved AYP status
- 2004 – Achieved AYP status
- 2003 – Warning AYP status due to lagging student academic achievement
- PSSA Results
Pennsylvania System of School Assessments, commonly called PSSAs are No Child Left Behind Act related examinations which were administered from 2003 through 2012. The exams were administered in the Spring of each school year. In 2013, the Commonwealth of Pennsylvania changed its high school assessments to the Keystone Exams in Algebra 1, Reading/literature and Biology1. The exams are given at the end of the course, rather than all in the spring of the student's 11th grade year.[85]
- 11th Grade Reading
- 2012 – 57% on grade level. (23% below basic). In Pennsylvania, 67% of 11th graders on grade level. Ranks 15h out of 19 CSIU region 11th grades for reading.[86]
- 2011 – 68% (20% below basic). State – 66%. Ranks 10th out of 19 CSIU region 11th grades for reading.[87]
- 2010 – 72%, State – 66%
- 2009 – 56%, State – 65% [88]
- 2008 – 48%, State – 65%
- 2007 – 67%, State – 65%[89]
- 11th Grade Math
- 2012 – 32% on grade level. (41% below basic). In Pennsylvania, 59% of 11th graders are on grade level. Ranked 17th out of 19 CSIU region 11th grades for Math.
- 2011 – 59% (22% below basic). State – 60%. Ranked 12th out of 19 CSIU region 11th grades for Math.[90]
- 2010 – 63%, State – 59% [53]
- 2009 – 50%, State – 56% [91]
- 2008 – 48%, State – 56%
- 2007 – 55%, State – 53%
- 11th Grade Science
- 2012 – 33%, (14% below basic). State – 42%. Ranked 16th out of 19 CSIU region 11th grades for Science.
- 2011 – 39%, (9% below basic). State – 40%. Ranked 11th out of 19 CSIU region 11th grades for Science.[92]
- 2010 – 39%, State – 39%
- 2009 – 29%, State – 40%
- 2008 – 21%, State – 39% [93]
Science in Motion Mount Carmel Area High School took advantage of a state program called Science in Motion which brought college professors and sophisticated science equipment to the school to raise science awareness and to provide inquiry-based experiences for the students. The Science in Motion program was funded by a state appropriation and cost the school nothing to participate.[94] Susquehanna University provided the science enrichment experiences to schools in the region.
College remediation
According to a Pennsylvania Department of Education study released in January 2009, 21% of Mount Carmel Area School District graduates required remediation in mathematics and or reading before they were prepared to take college level courses in the Pennsylvania State System of Higher Education or community colleges.[95] Less than 66% of Pennsylvania high school graduates, who enroll in a four-year college in Pennsylvania, will earn a bachelor's degree within six years. Among Pennsylvania high school graduates pursuing an associate degree, only one in three graduate in three years.[96] Per the Pennsylvania Department of Education, one in three recent high school graduates who attend Pennsylvania's public universities and community colleges takes at least one remedial course in math, reading or English.
Dual enrollment
The Mount Carmel Area High School offers a dual enrollment program. This state program permits high school students to take courses, at local higher education institutions, to earn college credits. Students remain enrolled at their high school. The courses count towards high school graduation requirements and towards earning a college degree. The students continue to have full access to activities at their high school. The college credits are offered at a deeply discounted rate. In 2010, the state offered a small grant to assist students in costs for tuition, fees and books.[97] Under the Pennsylvania Transfer and Articulation Agreement, many Pennsylvania colleges and universities accept these credits for students who transfer to their institutions.[98] Under state rules, other students that reside in the district, who attend a private school, a charter school or are home schooled are eligible to participate in this program.[99] In 2010, Governor Edward Rendell eliminated the grants to students, from the Commonwealth, due to a state budget crisis.
For the 2009–10 funding year, the school district received a state grant of $13,255 for the program.[100]
SAT scores
In 2016, 52 Mount Carmel Area School District students took the SAT exams. The district's Verbal Average Score was 463. The Math average score was 481. The Writing average score was 453.[101] The College Board also reported that statewide 92,569 pupils took the exams with average scores declining again in all three measurers to: 494 in reading, 508 in math and 482 in writing.[102] Among the 12 high schools in the CSIU16 region, Mount Carmel Area High School SAT scores ranked 9th locally and was below the state average.[103] Nationally, 1,681,134 students took the SATs.[104]
In 2015, 58 Mount Carmel Area School District students took the SAT exams. The district's Verbal Average Score was 477. The Math average score was 481. The Writing average score was 442.[105] The College Board also reported that statewide 96,826 pupils took the exams with average scores declining in all three measurers to: 495 in reading, 511 in math and 484 in writing.[106]
In 2014, 64 Mount Carmel Area School District students took the SAT exams. The district's Verbal Average Score was 468. The Math average score was 473. The Writing average score was 434.[107] Statewide in Pennsylvania, Verbal Average Score was 497. The Math average score was 504. The Writing average score was 480. The College Board also reported that nationwide scores were: 497 in reading, 513 in math and 487 in writing.[108]
In 2013, 88 Mount Carmel Area School District students took the SAT exams. The district's Verbal Average Score was 471. The Math average score was 454. The Writing average score was 447. The College Board reported that statewide scores were: 494 in reading, 504 in math and 482 in writing. The nationwide SAT results were the same as in 2012.[109]
In 2012, 72 Mount Carmel Area School District students took the SAT exams. The district's Verbal Average Score was 450. The Math average score was 464. The Writing average score was 448. The statewide Verbal SAT exams results were: Verbal 491, Math 501, Writing 480. In the USA, 1.65 million students took the exams achieving scores: Verbal 496, Math 514, Writing 488. According to the College Board the maximum score on each section was 800, and 360 students nationwide scored a perfect 2,400.
In 2011, 86 Mount Carmel Area School District students took the SAT exams. The district's Verbal Average Score was 460. The Math average score was 465. The Writing average score was 450.[110] Pennsylvania ranked 40th among states with SAT scores: Verbal – 493, Math – 501, Writing – 479.[111] In the United States, 1.65 million students took the exam in 2011. They averaged 497 (out of 800) verbal, 514 math and 489 in writing.[112]
The Pennsylvania Department of Education compared the SAT data of students in rural areas of Pennsylvania to students in urban areas. From 2003 to 2005, the average total SAT score for students in rural Pennsylvania was 992, while urban students averaged 1,006. During the same period, 28 percent of 11th and 12th graders in rural school districts took the exam, compared to 32 percent of urban students in the same grades. The average math and verbal scores were 495 and 497, respectively, for rural students, while urban test-takers averaged 499 and 507, respectively. Pennsylvania’s SAT composite score ranked low on the national scale in 2004. The composite SAT score of 1,003 left Pennsylvania ranking 44 out of the 50 states and Washington, DC.[113]
The Pennsylvania Department of Education reported that 71 percent of students in rural areas of Pennsylvania chose to continue their education after high school in 2003, whereas 79 percent of urban high school graduates opted to continue their education.
AP Courses
In 2013, Mount Carmel Area High School offered 5 Advanced Placement (AP) courses at a higher cost than regular courses. Students have the option of taking College Board approved courses and then taking the College Board's examination in the Spring. Students, who achieve a 3 or better on the exam, may be awarded college credits at US universities and colleges. Each higher education institution sets its own standards about what level of credits are awarded to a student based on their AP exam score. Most higher education give credits for scores of 4 or 5. Some schools also give credits for scores of 3. High schools give credits towards graduation to students who take the school's AP class. At Mount Carmel Area High School 10% of students who took an AP course earned a 3 or better on the exam.[114]
In 2014, Mount Carmel Area High School offered 9 Advanced Placement (AP) courses at a higher cost than regular courses. The fee for each AP Exam is $91 (2014).[115] The school normally retains $9 of that fee as a rebate to help with administrative costs. In 2014, just 15% of Mount Carmel Area pupils who took the AP exam, achieved a 3 or better.[116]
ACE
Mount Carmel Area School District students have access to Bloomsburg University's Summer College and Advanced College Experience (ACE) during the summer of their sophomore, junior and senior years (after high school graduation). Tuition is deeply discounted to 75% of the regular student rate.[120] Successful students earn college credits that can be transferred to other Pennsylvania public colleges and universities through the Pennsylvania Transfer and Articulation Center (PA TRAC) system.[98]
Mount Carmel Junior High School
Mount Carmel Junior High School is located at 600 W 5th Street, Mount Carmel. In 2016, enrollment declined to 221 pupils, in grades 7th through 8th, with 64% of pupils eligible for a free lunch due to family poverty. Additionally, 22% of pupils received special education services, while none of the pupils were identified as gifted.[121] According to a 2016 report by the Pennsylvania Department of Education, 100% of its teachers were rated "Highly Qualified" under No Child Left Behind.[122]
In 2013, Mount Carmel Junior High School reported an enrollment of 253 pupils in grades 7th and 8th, with 54.9% of pupils eligible for a federal free lunch due to family poverty. Additionally, 4.35% of pupils received special education services, while 4.35% of pupils were identified as gifted.[123] According to a 2013 report by the Pennsylvania Department of Education, 100% of its teachers were rated "Highly Qualified" under No Child Left Behind.[124]
- 2016 School Performance Profile
SPP 63.1 out of 100 points. Mount Carmel Area junior High School PSSA mandated testing results were: just 48% of students in 8th grade were on grade level in reading, while only 28% of students demonstrated on grade level in mathematics. In science, just 56% of eighth grade pupils demonstrated on grade level science understanding.[125] In 7th grade, 54% of pupils were on grade level in reading, while just 35% demonstrated on grade level math skills. Statewide just 31% of eighth graders demonstrated on grade level in math and 58% of eighth graders were on grade level in reading. In science, 57.7% of eighth graders showed on grade level proficiency. Among 7th graders, just 37% of students demonstrated on grade evel skills in mathematics. In seventh grade reading, 58% were on grade level. Sixth graders had 61.5% showing on grade level math skills. In reading, 61.5% of sixth graders were on grade level.[126]
- 2015 School Performance Profile
The PDE reported that 47.8% of 8th grade students at Mount Carmel Junior High School students were on grade level (15.6% below basic) in reading on the PSSAs given in April 2015. In math/Algebra 1, 27.7% of 8th grade students showed on grade level skills (33% below basic). In science, 50% of the school’s 8th graders demonstrated on grade level science understanding (30% below basic). No eighth grade writing scores were reported. In 7th grade, 38.4% were on grade level in reading (7% below basic), while 29.5% showed on grade level math skills (30% below basic). Statewide 58% of eighth (8th) graders were on grade level in reading, while 29% demonstrated on grade level math skills. Pennsylvania 7th graders were58% on grade level in reading and 33% demonstrated on grade level math skills. Among sixth (6th) graders, 60.7% were reading on grade level, while 39.7% demonstrated on grade level math skills.[127]
- 2014 School Performance Profile
Mount Carmel Junior High School achieved 65.2 out of 100. Reflects on grade level reading, mathematics and science achievement. In reading/literature – 65% were on grade level. In Algebra 1/Math, 68% showed on grade level mathematics skills. In Science, 53.8% of 8th graders showed on grade level science understanding. In writing, 66.6% of the 8th grade students demonstrated on grade level writing skills.[128]
- 2013 School Performance Profile
Mount Carmel Junior High School achieved 65 out of 100. Reflects on grade level reading, writing, mathematics and science achievement. In reading, just 65% of the students were on grade level. In Mathematics/Algebra 1, 73.7% of the students showed on grade level skills. In Science, only 54% of the 8th graders demonstrated on grade level understanding. In writing, 55% of the 8th grade students demonstrated on grade level writing skills.[129]
- AYP status;
In 2012 and 2011, Mount Carmel Junior High School achieved AYP status.[130] In 2010, the school was in Making Progress: in School Improvement I AYP status. In 2009, the school was in Did Not Make AYP School Improvement I status.[131] The Pennsylvania Department of Education required the administration to develop and implement a School Improvement plan to raise student academic achievement in reading and mathematics.
- PSSA Results
Pennsylvania System of School Assessments, commonly called PSSAs are NCLB related examination given in the Spring of each school year. Seventh graders have been tested in reading and mathematics since 2006. Eighth graders are tested in: reading, writing, mathematics and Science. Beginning in the Spring of 2013, eighth graders, who are enrolled in Algebra I take the Keystone Exam for Algebra I at the end of the course. The testing of 8th grade in reading and mathematics began in 1999.[132] Testing in science began in 2007. The goal is for 100% of students to be on grade level or better in reading and mathematics, by the Spring of 2014. The tests focus on the state's Academic Standards for reading, writing, mathematics and science.[133] The standards were published in 1998 and are mandated by the Pennsylvania State Board of Education.[134] In 2014, the Commonwealth adopted the Pennsylvania Core Standards – Mathematics.[135]
|
|
- 8th Grade Science:
- 2012 – 49% on grade level (19% below basic). State – 59% of 8th graders were on grade level.
- 2011 – 59.6% (16% below basic). State – 58.3% [143]
- 2010 – 54%, State – 57%
- 2009 – 53%, State – 54%
- 2008 – 53%, State – 52% [144] The eighth grade ranked 13th out of 19 Central Pennsylvania IU16 schools for science scores in 2008.[145]
|
7th Grade Math:
|
Elementary School
Mount Carmel Area Elementary School is located at 630 W 5th Street, Mount Carmel. In 2016, the school's enrollment was 863 pupils in grades preschool through 6th, with 71% of pupils receiving a federal free or reduced-price meals due to family poverty. Additionally, 18.6% of the pupils receive special education services, while none are identified as gifted.[146] According to a report by the Pennsylvania Department of Education, 100% of the teachers were rated highly qualified under No Child Left Behind. The school provides both a taxpayer-funded preschool and full-day kindergarten.[147] The school is a federally designated Title I school.
In 2013, Mount Carmel Area Elementary School's enrollment was 869 pupils in preschool through 6th, with 61% of pupils receiving a federal free or reduced-price meals due to family poverty. Additionally, 13.9% of the pupils receive special education services, while 1.7% are identified as gifted.[148] According to a report by the Pennsylvania Department of Education, 100% of the 53 teachers were rated highly qualified under the federal No Child Left Behind Act. The school had provided full-day kindergarten since 2008.[149] The school is a federally designated Title I school.
In 2010, Mount Carmel Area Elementary School had 834 students enrolled in grades preschool through 6th grades, with 452 receiving a federal free or reduced-price lunch due to family poverty. The school employed 58 teachers, yielding a student–teacher ratio of 14:1.[150]
- 2016 School Performance Profile
SPP 73.2 out of 100 points. Mount Carmel Area Elementary School PSSA mandated testing results were: 60% of students in 6th grade were on grade level in reading, while just 27% of students demonstrated on grade level mathematics skills. Only 48% of students in 5th grade were on grade level in reading, while just 24% of students demonstrated on grade level mathematics skills. In 4th grade, 51% were on grade level in reading, while only 26% demonstrated on grade level math skills. In science, 88% of fourth grade pupils demonstrated on grade level understanding of science concepts in the state standards. Among the school's third graders, 49% were on grade level in reading and just 35% showed on grade level mathematics skills.[151][152]
- 2015 School Performance Profile
The PDE withheld the school's SPP for 2015. Among Mount Carmel Area Elementary School (MCAES) 6th graders, 67% were on grade level in reading and 37.6% were on grade level in mathematics. According to the Pennsylvania Department of Education, 48% of 5th grade students at MCAES were on grade level in reading on the PSSAs given in April 2015. In mathematics, 17.7% of 5th grade students showed on grade level skills. No fifth grade writing scores were reported. In 4th grade, 49% were on grade level in reading, while 27.8% showed on grade level math skills. In science, 81.4% of fourth graders showed on grade level understanding. Among third (3rd) graders, 56.7% were on grade level in reading and 34.8% were on grade level in mathematics.[153] Among sixth (6th) graders, 60.7% were reading on grade level, while 39.7% demonstrated on grade level math skills. Statewide 61.9% of fifth (5th) graders were on grade level in reading, while 42.8% demonstrated on grade level math skills. Pennsylvania 4th graders were 58.6% on grade level in reading and 44.4% demonstrated on grade level math skills. In science, 77.3% of fourth graders showed on grade level understanding. Among Pennsylvania third (3rd) graders, 62% were reading on grade level, while 48.5% demonstrated on grade level math skills.[127]
- 2014 School Performance Profile
Mount Carmel Area Elementary School achieved a score of 81.4 out of 100. The score reflects on grade level: reading, science, writing and mathematics achievement. In 2013–14, only 65% of the students were reading on grade level in grades 3rd through 5th. In 3rd grade, just 63.8% of the pupils were reading on grade level. In math, 69% were on grade level (3rd–5th grades). In 4th grade science, just 86% of the pupils demonstrated on grade level understanding. In writing, 76 of 5th grade pupils demonstrated on grade level skills.[154]
- 2013 School Performance Profile
Mount Carmel Area Elementary School achieved a score of 64.8 out of 100. The score reflects on grade level: reading, science, writing and mathematics achievement. In 2012–13, only 62% of the students were reading on grade level in grades 3rd through 6th. In 3rd grade, 68% of the pupils were reading on grade level. In math, 71% were on grade level (3rd–6th grades). In 4th grade science, 90% of the pupils demonstrated on grade level understanding. In writing only 49% of 5th grade pupils demonstrated on grade level skills.[155]
- AYP history status
In 2012, Mount Carmel Area Elementary School declined to Warning AYP status due to chronic, lagging student academic achievement especially in reading.[156] Mount Carmel Area Elementary School achieved AYP status in 2010 and 2011.[157] The attendance rate was 94% in both years.[158]
|
6th Grade Reading:
|
6th Grade Math:
|
|
5th Grade Reading:
|
5th Grade Math:
|
|
|
- 4th Grade Science
- 2012 – 95%, 71% advanced. State – 82%. Ranks 9th among 4th grades in CSIU16 region.
- 2011 – 100%, 89.9% advanced. State – 82.9% [166]
- 2010 – 93.6%, 63% advanced. State – 81%
- 2009 – 81.9%, 45% advanced. State – 83%
- 2008 – 82.3%, State – 81%
|
|
Preschool
Mount Carmel Area School District receives state funding to provide free preschool at the elementary school. For the 2011 school year, Pre-K Counts was funded at the 2010 levels of $83.6 million statewide in Gov. Tom Corbett's proposed budget,. The state also supplements the federal Head Start preschool program with an additional $37.6 million. Pre-K Counts funding was initiated during the Rendell administration. In 2007–08 the state funded Pre-K Counts at $75 million. Mount Carmel Area School District received funding in 2007–08.[168] In 2009–2010, the district received $316,000 to provide preschool to 42 children.[169][170] For the 2013–2014 school year, Mount Carmel Area School District received $297,160 in PreK Counts funding from the state.[171]
Special education
In December 2012, Mount Carmel Area School District administration reported that 237 pupils, or 14.9% of the district's pupils, received special education services, with 57.4% of the identified pupils having specific learning disabilities.[172] In December 2010, the District administration reported that 199 pupils, or 12.6% of the district's pupils, received special education services.[173] Among the identified students, 56% had a specific learning disability. In 2009, 195 Mount Carmel Area School District students received special education services.
In 2007, Pennsylvania Secretary of Education Gerald Zahorchak testified before the Pennsylvania House Education Committee regarding full-day kindergarten. He claimed that districts which offered the program would see a significant decrease in special education students due to early identification and early intervention. He asserted the high cost of full-day kindergarten would be recouped by districts in lower special education costs.[174] Mount Carmel has provided taxpayer-funded preschool and full-day kindergarten since at least 2003. Mount Carmel Area School District has seen an increase in the percentage of special education students it serves, yielding no savings.
In 2010, the state of Pennsylvania provided $1,026,815,000 for special education services. This funding is in addition to the state's basic education per pupil funding, as well as, all other state and federal funding.[175] The Pennsylvania Special Education funding system assumes that 16% of the district’s students receive special education services. It also assumes that each student’s needs accrue the same level of costs.[176] The state requires each district to have a three-year special education plan to meet the unique needs of its special education students.[177] Overidentification of students, in order to increase state funding, has been an issue in the Commonwealth. Some districts have more than 20% of its students receiving special education services while others have 10% supported through special education.[178]
Mount Carmel Area School District received a $1,050,288 supplement for special education services in 2010.[179] For the 2011–2012, 2012–2013, and 2013–2014 school years, all Pennsylvania public school districts received the same level of funding for special education that they received in 2010–2011. This level funding is provided regardless of changes in the number of pupils who need special education services and regardless of the level of services the respective students required.[180] In 2014–15, Mount Carmel Area received an increase to $1,068,874 in special education funding from the state.
Gifted education
Mount Carmel Area School District Administration reported that 47 or 2.68% of its students were gifted in 2009.[181] By law, the district must provide mentally gifted programs at all grade levels. The referral process for a gifted evaluation can be initiated by teachers or parents by contacting the student’s building principal and requesting an evaluation. All requests must be made in writing. To be eligible for mentally gifted programs in Pennsylvania, a student must have a cognitive ability of at least 130 as measured on a standardized ability test by a certified school psychologist. Other factors that indicate giftedness will also be considered for eligibility.[182][183]
Budget
Pennsylvania public school districts budget and expend funds according to procedures mandated by the General Assembly and the Pennsylvania Department of Education (PDE). An annual operating budget is prepared by school district administrative officials. A uniform form is furnished by the PDE and submitted to the board of school directors for approval prior to the beginning of each fiscal year on July 1.
Under Pennsylvania’s Taxpayer Relief Act, Act 1 of the Special Session of 2006, all school districts of the first class A, second class, third class and fourth class must adopt a preliminary budget proposal. The proposal must include estimated revenues and expenditures and the proposed tax rates. This proposed budget must be considered by the board no later than 90 days prior to the date of the election immediately preceding the fiscal year. The preliminary budget proposal must also be printed and made available for public inspection at least 20 days prior to its adoption. The board of school directors may hold a public hearing on the budget, but are not required to do so. The board must give at least 10 days’ public notice of its intent to adopt the final budget according to Act 1 of 2006.[184]
In May 2017, Mount Carmel Area School Board approved a two-year (July 1, 2016, to June 30, 2018) teacher contract. The terms include each teacher moving up a salary step in 2016-17 and 2017–18, raising their salaries and future pensions. The teachers will also receive $250 payment for in the 2017-18 school year. Beginning in January 2018, the teachers will begin paying a $250 deductible for a single health care plan and $750 deductible for a family health care plan. Prior to this teachers did not pay a deductible for health care.
For the 2012–2013 school year, the average salary of the teachers in the Mount Carmel Area School District was $42,054, while the cost of the benefits the teachers received was $22,373 for a total compensation of $64,427 a year.[185] The District employed 155 teachers and administrators with a maximum salary of $75,000.[186]
In 2011–2012, the average teacher salary in Mount Carmel Area School District was $43,833 a year, while the cost of the benefits teachers received was $18,217 per employee, for a total annual average teacher compensation of $62,050.[187] In 2011–12, the district employed 117 teachers and administrators with an average salary of $45,148 and a top salary of $67,000.[188] In September 2012, the Mount Carmel Area School Board voted to hire Bernie Stellar as superintendent with a starting salary of $90,000.[189] Stellar was awarded a five-year contract. He is a Mount Carmel Area School District alumnus and will remain the band director for the district. Stellar will receive additional compensation for his ongoing work with the band.
In 2009, Mount Carmel Area School District reported employing 152 teachers and administrators with a salary range of $31,000 to $101,468.[190] The average teacher salary was $43,265. Additionally, the teachers receive a defined benefit pension, health insurance, life insurance, vision insurance, professional development reimbursement, paid personal days, 10 paid sick days, and other benefits.[191]
In 2007, Mount Carmel Area School District employed 108 teachers who earned an average teacher salary of $38,246 for 180 days worked.[192] As of 2007, Pennsylvania ranked in the top 10 states in average teacher salaries. When adjusted for cost of living Pennsylvania ranked fourth in the nation for teacher compensation.[193] Additionally, the teachers receive a defined benefit pension, health insurance, professional development reimbursement, personal days, sick days, and other benefits.[194] According to Rep. Glen Grell, a trustee of the state teacher retirement fund, a 40-year educator can retire with a pension equal to 100 percent of their final salary.[195]
Per-pupil spending The Mount Carmel Area School District administrative costs per pupil were $553.68 in 2008. The lowest administrative cost per pupil in Pennsylvania was $398 per pupil.[196]
In 2008, the Mount Carmel Area School District administration reported that per-pupil spending was $9,126 which ranked 220th among Pennsylvania's 501 school districts. In 2010 the per-pupil spending had increased to $10,861.41.[197] Among the states, Pennsylvania’s total per pupil revenue (including all sources) ranked 11th at $15,023 per student, in 2008–09.[198] In 2007, the Pennsylvania per pupil total expenditures was $12,759.[199]
Tax and Revenue Anticipation Note In October 2015, the Mount Carmel Area School Board approved taking out a $5 million loan to cover its budget pending a resolution of the state's budget.[200] General operating costs in the district average approximately $1.2 million per month.
Reserves In 2008, Mount Carmel Area School District reported a balance of $500,000 in an unreserved-designated fund. The unreserved-undesignated fund balance was reported as $2,093,707. [201] In 2010, Mount Carmel Area Administration reported a decline to $1,099,318 in the unreserved-undesignated fund balance. There was $700,000 in its unreserved – designated fund. By 2012, the board had increased the reserves to $3,747,900.[202] Pennsylvania school district reserve funds are divided into two categories – designated and undesignated. The undesignated funds are not committed to any planned project. Designated funds and any other funds, such as capital reserves, are allocated to specific projects. School districts are required by state law to keep 5 percent of their annual spending in the undesignated reserve funds to preserve bond ratings. According to the Pennsylvania Department of Education, from 2003 to 2010, as a whole, Pennsylvania school districts amassed nearly $3 billion in reserved funds.[203]
Audit In January 2010, the Pennsylvania Auditor General conducted a performance audit of the district. The findings were reported to the school board and administration.[204]
Tuition Students who live in the Mount Carmel Area School District's attendance area may choose to attend one of Pennsylvania's 157 public charter schools. A student living in a neighboring public school district or a foreign exchange student may seek admission to Mount Carmel Area School District. For all these cases, the Pennsylvania Department of Education sets an annual tuition rate for each public school district. It is the amount the public school district pays to a charter school for each resident student that attends the charter and it is the amount a nonresident student's parents must pay to attend the district's schools. The 2012 tuition rates are Elementary School – $6,811, High School – $8,189[205]
The Mount Carmel Area School District is funded by a combination of: a local earned income tax,[206] a property tax, a real estate transfer tax 0.5%, coupled with substantial funding from the Commonwealth of Pennsylvania and the federal government.[207] Grants can provide an opportunity to supplement school funding without raising local taxes. Interest earnings on accounts also provide nontax income to the district. In the Commonwealth of Pennsylvania, pension income and Social Security income are exempted from state personal income tax and local earned income tax, regardless of the level of the individual’s personal wealth.[208] The average Pennsylvania public school teacher pension in 2011 exceeds $60,000 a year plus they receive federal Social Security benefits: both are free of Pennsylvania state income tax and local income tax which funds local public schools.[209]
State basic education funding
According to a report from Representative Todd Stephens office, Mount Carmel Area School District receives 69.2% of its annual district revenues from the state.[210] This substantially exceeds state education advocates goal of the state providing 50% of district funding.[211][212][213] In December 2014, the Pennsylvania Education Funding Reform Commission conducted a hearing. The commission developed a new basic education funding formula which sets a new way to distribute state basic education dollars. It abolished the practice of "hold harmless" funding, which gave districts at least the same as they got the previous school year regardless of declining enrollment. The plan became law in June 2016 (House Bill 1552).[214][215][216]
For the 2017-18 school year, Mount Carmel Area School District received an increase to $8,289,563 in Basic Education Funding from the Commonwealth of Pennsylvania.[217] Pennsylvania once again increased its public education spending to a record high of $5.995 billion. It was a $100 million increase, 1.7% increase over the 2016-17 state education appropriation.[218] Additionally, the state continued to fund its Ready to Learn grants at $250 million and Special Education funding received a $25 million increase to $1.121 billion.[219] The state also paid $529,5 million to the school employee social security fund and another $2.304 billion to the teacher’s pension fund, an increase of 7.6% over the state’s 2016-17 payment. The state maintained its $100 million reimbursement to school districts for transportation costs. Governor Wolf had proposed cutting the funding by 50% shifting the costs to local taxpayers.[220][221]
For the 2016-17 school year, Mount Carmel Area School District received $8,248,496 in Basic Education Funding from the Commonwealth of Pennsylvania. This is a 2.7% increase over 2015-16 funding to the district. The highest percentage of BEF increase in Northumberland County was 3.3% awarded to Shikellamy School District under the state’s Basic Education Funding formula. For the 2016-17 school year, Pennsylvania increased its public education spending to a record high of $5,895 billion. It was a $200 million increase, 3.51% increase over the 2015-16 appropriation.[222] The state also funded Ready to Learn grants at $250 million and Special Education funding received a $20 million increase.[223] The state also paid $492 million to the school employee social security fund and another $2.064 billion to the teacher’s pension fund.[224] Statewide Conestoga Valley School District received a 13.3% increase in state BEF funding. Five PA public school districts received an increase of 10% or greater in Basic Education funding over their 2015-16 funding.
For the 2015–16 school year, Governor Tom Wolf released a partial Basic Education Funding of $3,859,085 to Mount Carmel Area School District, in January 2016.[225] This was part of $10.3 billion in school funding withheld from the public schools, by the Governor since the summer of 2015.[226] The dispersement did not follow the new Basic Education Fair Funding formula which had been established by the Pennsylvania General Assembly in June 2015.[227] The District also received $280,252 in Ready To Learn grant. Ten (10) Pennsylvania school districts received no increase in Basic Education funding under Governor Wolf.[228][229] In April 2016, Governor Wolf announced his finalized dispersement of 2015–16 state Basic Education Funding. Mount Carmel Area School District received a 2.05% increase for a total funding of $8,012,650.[230] The highest increase in funding statewide was awarded by Governor Wolf to Wilkinsburg Borough School District which got a 48.07% increase in state Basic Education Funding. The average BEF increase among the Commonwealth’s 500 public school districts for 2015–16 was 2.21%. In Northumberland County, the highest percentage increase was awarded to Shikellamy School District a 2.79% increase.
For the 2014–15 school year, Mount Carmel Area School District received $7,848,889 in State Basic Education funding. The district also received $124,089 in Accountability Block Grant funding and $132,224 in new Ready To Learn Block grant. The State’s enacted Education Budget includes $5,526,129,000 for the 2014–2015 Basic Education Funding.[231] The Education budget also includes Accountability Block Grant funding at $100 million and $241 million in new Ready to Learn funding for public schools that focus on student achievement and academic success. The State is paying $500.8 million to Social Security on the school employees behalf and another $1.16 billion to the state teachers pension system (PSERS). In total, Pennsylvania’s Education budget for K-12 public schools is $10 billion. This was a $305 million increase over 2013–2014 state spending and the greatest amount ever allotted by the Commonwealth for its public schools.[232]
For the 2013–14 school year, Mount Carmel Area School District received a 1.7% increase or $7,843,102 in Pennsylvania Basic Education Funding. This is $129,609 more than its 2012–13 state BEF to the district. Additionally, Mount Carmel Area School District received $124,089 in Accountability Block Grant funding to focus on academic achievement and level funding for special education services. Among the public school districts in Northumberland County, Shikellamy School District received the highest percentage increase in BEF at 1.9%. The Mount Carmel Area School District has the option of applying for several other state and federal grants to increase revenues. The Commonwealth’s budget increased Basic Education Funding statewide by $123 million to over $5.5 billion. Most of Pennsylvania’s 500 public school districts received an increase of Basic Education Funding in a range of 0.9% to 4%. Eight public school districts received exceptionally high funding increases of 10% to 16%. The highest increase in state funding was awarded to Austin Area School District which received a 22.5% increase in Basic Education Funding.[233] The highest percent of state spending per student is in the Chester-Upland district, where roughly 78 percent comes from state coffers. In Philadelphia, it is nearly 49 percent.[234] As a part of the education budget, the state provided the PSERS (Pennsylvania school employee pension fund) with $1,017,000,000 and Social Security payments for school employees of $495 million.[235]
For the 2012–13 school year, the Mount Carmel Area School District will receive $7,837,582.[236] The Governor's Executive Budget for 2012–2013 includes $9.34 billion for kindergarten through 12th grade public education, including $5.4 billion in basic education funding, which is an increase of $49 million over the 2011–12 budget. The state provided $100 million for the Accountability Block grant. Mount Carmel Area School District received $124,089 in Accountability Block Grant funding to focus on academic achievement. The state paid $544.4 million for School Employees’ Social Security and $856 million for School Employees’ Retirement fund called PSERS.[237] This amount is a $21,823,000 increase (0.34%) over the 2011–2012 appropriations for Basic Education Funding, School Employees' Social Security, Pupil Transportation, Nonpublic and Charter School Pupil Transportation. Since taking office, Corbett’s first two budgets have restored more than $918 million in support of public schools, compensating for the $1 billion in federal stimulus dollars lost at the end of the 2010–11 school year.
In 2011–12 budget year, Mount Carmel Area School District received $7,713,150 in state Basic Education Funding.[238][239] Additionally, the district will receive $124,089 in Accountability Block Grant funding. The enacted Pennsylvania state Education budget includes $5,354,629,000 for the 2011–2012 Basic Education Funding appropriation. This amount is a $233,290,000 increase (4.6%) over the enacted State appropriation for 2010–2011. The highest increase in state basic education funding was awarded to Duquesne City School District, which got a 49% increase in state funding for 2011–12.[240] Some public school Districts experienced a reduction in funding due to the loss of federal stimulus funding which ended in 2011. In 2010, the Mount Carmel Area School District reported that 915 pupils received a free or reduced-price lunch due to the family meeting the federal poverty level.
For the 2010–11 budget year, Mount Carmel Area School District received a 5.92% increase, in state basic education funding, for a total of $8,013,204. The highest increase in state funding, among Northumberland County school districts, was awarded to Milton Area School District at 6.46% increase. One hundred fifty school districts in Pennsylvania received the 2% base increase for budget year 2010–11. The highest increase in the state went to Kennett Consolidated School District of Chester County which was awarded a 23.65% increase, in state basic education funding.[241] The state's hold harmless policy regarding state basic education funding continued where each district received at least the same amount as it received the prior school year, even when enrollment had significantly declined. The amount of increase each school district received was set by Governor Edward Rendell and then Secretary of Education Gerald Zahorchak, as a part of the state budget proposal given each February. This was the second year of Governor Rendell’s policy to fund some public school districts at a far greater rate than others.[242]
In the 2009–2010 budget year, the Commonwealth of Pennsylvania provided a 6.23% increase in Basic Education Funding, to the Mount Carmel Area School District for a total of $8,013,205.[243] The district also received supplemental funding for: Title I (federal funding for low-income students), for district size, a poverty supplement from the Commonwealth and more. In Pennsylvania, the highest state funding increase was 22.31% to Muhlenberg School District.[244] The amount of increase each school district received was set by Governor Edward G. Rendell and the Secretary of Education Gerald Zahorchak, as a part of the state budget proposal.[245]
In 2008–09, the state Basic Education Funding to the Mount Carmel Area School District was $7,543,570.75. According to the Pennsylvania Department of Education, 877 students received free or reduced-price lunches due to low family income in the 2007–2008 school year.
Accountability Block Grant
The state provides additional education funding to schools in the form of Accountability Block Grants. The use of these funds is strictly focused on specific state approved uses designed to improve student academic achievement. Mount Carmel Area School District uses its $336,809 to fund all day kindergarten for the sixth year and a taxpayer-funded preschool program. These annual funds are in addition to the state's basic education funding and all federal funding.[246] School Districts apply each year for Accountability Block Grants.[247] In 2009–10, the state provided $271.4 million in Accountability Block grants $199.5 million went to providing all-day kindergartens.[248]
Ready to Learn grant
Beginning in the 2014–2015 budget, the State funded a new Ready to Learn Grant for public schools. A total of $100 million is allocated through a formula to districts based on the number of students, level of poverty of community as calculated by its market value/personal income aid ratio (MV/PI AR) and the number of English language learners. Ready to Learn Block Grant funds may be used by the districts for: school safety; Ready by 3 early childhood intervention programs; individualized learning programs; and science, technology, engineering and math (STEM) programs.[249]
Mount Carmel Area School District will receive $132,224 in Ready to Learn Grant dollars in addition to State Basic Education funding, Special Education funding, Accountability Block Grant funding, PreK Counts funding, reimbursement for Social Security payments for employees and other state grants which the district must apply to receive.
Science It’s Elementary grant
Mount Carmel Area Elementary School successfully applied to participate and received a Science It’s Elementary grant in 2008–09. For the 2008–09 school year, the program was offered in 143 schools reaching 2,847 teachers and 66,973 students across Pennsylvania.[250] In 2007, the Pennsylvania Department of Education initiated an effort to improve science instruction in the Commonwealth’s public elementary schools. Called Science: It’s Elementary, the program is a hands on instruction approach for elementary science classes that develops problem-solving and critical thinking skills.[251] To encourage schools to adopt the program’s standards aligned curriculum, the state provided a grant to cover the costs of materials and extensive mandatory teacher training.[252] The district was required to develop a three-year implementation plan for the participating school. They had to appoint a district liaison who was paid $3000 by PDE to serve as the conduit of all information between the district and the Department and its agents along with submitting orders and distributing supplies to implementing teachers. For the 2006–07 state education budget, $10 million was allocated. The 2006–07 State Education Budget provided $635 million in new spending for pre-K through 12th grades for the 2006–07 school year. This marks an 8-percent increase over 2005–06 public school funding.[253] The grant program was expanded to $14.5 million in the 2008–09 budget. The grant was discontinued in 2010 by Governor Rendell due to a massive state budget.
Classrooms for the Future grant
The Classroom for the Future state program provided districts with hundreds of thousands of extra state funding to buy laptop computers for each core curriculum high school class (English, Science, History, Mathematics) and paid for mandatory teacher training to optimize the computers' use in the classroom for improving instruction. The program was funded from 2006–2009. Mount Carmel Area School District administration applied but was denied the grant in 2006–2007. In 2007–2008, the district received $$162,473 in funding. For the 2008–2009, school year the district received a final $45,413 for a total funding of $207,886. Among the public school districts in Northumberland County, Shikellamy School District received the highest funding at $373,690. The highest funding statewide was awarded to Philadelphia City School District in Philadelphia County – $9,409,073. In 2010, Classrooms for the Future funding was curtailed statewide due to a massive state budget crisis. Of the 501 public school districts in Pennsylvania, 447 of them received Classrooms for the Future grant awards.[254]
Education Assistance grant
The state's EAP funding provides for the continuing support of tutoring services and other programs to address the academic needs of eligible students. Funds are available to eligible school districts and full-time career and technology centers (CTC) in which one or more schools have failed to meet at least one academic performance target, as provided for in Section 1512-C of the Pennsylvania Public School Code. In 2010–11 the Mount Carmel Area School District did not apply for funding.[255]
PreK Counts grant
Mount Carmel Area School District receives state funding to provide preschool at the elementary school. For the 2011 school year, Pre-K Counts was funded at the 2010 levels of $83.6 million statewide in Gov. Tom Corbett's proposed budget,. The state also supplements the federal Head Start preschool program with an additional $37.6 million. Pre-K Counts funding was initiated during the Rendell administration. In 2007–08 the state funded Pre-K Counts at $75 million. Mount Carmel Area School District received funding in 2007–2008.[168] In 2009–2010, the district received $316,000 to provide preschool to 42 children.[169][170] For the 2011–12 school year, the district received $300,200 grant to provide preschool for 38 children.[256] In 2013–14, Mount Carmel Area School District received a state grant of $297,160 to run its preschool for 39 children.[257]
Project 720
Project 720 was a high school reform program implemented for three years under the Rendell administration. The intent was to increase academic rigor and improve the instruction of teachers in the Commonwealth’s high schools. Teachers were expected to use data driven instructional practices and to meet the needs of diverse learners.[258] The 720 in the name referred to the number of days a student was in high school in ninth through 12th grades.[259] High schools applied for funding and were required to agree to report to the PDE their plans, their actions and the outcomes. In 2007–08 budget year, the Commonwealth provided $11 million in funding. Mount Carmel Area School District was one of 161 PA public school districts to apply, receiving $69,944 funding over three years.[260][261] For 2010–11, Project 720 funding was decreased to $1.7 million by Governor Rendell. The grant program was discontinued effective with the 2011–12 state budget.[262]
Healthy High 5 grant
In 2012, Mount Carmel Junior Senior High School was awarded a $50,000 grant from the Highmark Foundation. The funds were to be used for programming that focuses on the nutritional and physical activity needs of students. Parental outreach is included in the process. Thirteen schools in Pennsylvania were selected for funding. Mount Carmel was the only district in Northumberland County that received funding.
Other grants
Mount Carmel Area School District did not participate in: Pennsylvania Department of Environmental Protection's Environmental Education annual grants;[263][264] 2012 and 2013 Striving Readers Comprehensive Literacy grants;[265] 2012 and 2013 Pennsylvania Hybrid Learning Grants;[266] nor the federal 21st Century Learning grants.
Federal Stimulus grant
Mount Carmel Area School District received $1,469,207 in ARRA – Federal Stimulus money to be used in specific programs like special education and meeting the academic needs of low-income students.[267] This was in addition to all regular, annual state and federal funding. This funding is for the 2009-2001 school years.[268] Due to the temporary nature of the funding, schools were repeatedly advised by the Pennsylvania Department of Education, the Pennsylvania Senate Education Committee, the Governor and the Pennsylvania School Board Association, to use the funds for one-time expenditures like acquiring equipment, making repairs to buildings, training teachers to provide more effective instruction or purchasing books and software.
Race to the Top grant
Mount Carmel Area School District officials did not apply for the Race to the Top federal grant which would have brought the district millions in additional federal dollars for committing to improve student academic achievement.[269] To participate the administration, school board and teachers' union were required to sign an agreement to prioritize improving student academic success.[270] In Pennsylvania, 120 public school districts and 56 charter schools agreed to participate.[271] Pennsylvania was not approved for the grant. According to then Governor Rendell, failure of districts to agree to participate was cited as one reason that Pennsylvania was not approved for the grant.[272]
Common Cents state initiative
The Mount Carmel Area School District School Board chose to not participate in the Pennsylvania Department of Education Common Cents program. The program called for the state to audit the district, at no cost to local taxpayers, to identify ways the district could save tax dollars.[273] After the review of the information, the district was not required to implement the recommended cost savings changes.
Real estate taxes
Property tax rates in 2016–17 were set by the Mount Carmel School Board for Northumberland County at 45.9500 mills and at 37.8400 mills for properties in Columbia County.[274]
A mill is $1 of tax for every $1,000 of a property's assessed value. Property taxes, in the Commonwealth of Pennsylvania, apply only to real estate – land and buildings. The property tax is not levied on cars, business inventory, or other personal property. Certain types of property are exempt from property taxes, including: places of worship, places of burial, private social clubs, charitable and educational institutions and government property. Irregular property reassessments have become a serious issue in the commonwealth as it creates a significant disparity in taxation within a community and across a region. Additionally, service related, disabled US military veterans may seek an exemption from paying property taxes. Pennsylvania school district revenues are dominated by two main sources: 1) Property tax collections, which account for the vast majority (between 75–85%) of local revenues; and 2) Act 511 tax collections, which are around 15% of revenues for school districts.[275] School districts located in more than one county are required to apportion the tax levy based on the market value in each county as determined by the State Tax Equalization Board pursuant to section 672.1 of the School Code. As a result, the tax rate increases are not the same for each county in a multi-county school district.[276]
- 2015–16 – 40.4700 mills for Northumberland County and 19.2100 for Columbia County.
- 2014–15 – 40.4700 mills for Northumberland County and 19.2100 for Columbia County.[277]
- 2013–14 – 40.4700 mills for Northumberland County and 19.2100 for Columbia County.
- 2012–13 – 40.4700 mills for Northumberland County and 19.2100 for Columbia County.[278]
- 2011–12 – 40.4700 mills for Northumberland County and 19.2100 for Columbia County.[279]
- 2010–11 – 40.4700 mills for Northumberland County and 19.0400 mills for Columbia County.[280]
- 2009–10 – 40.2670 mills for Northumberland County and 21.4174 mills for Columbia County.[281][282]
- 2008–09 – 38.2600 mills for Northumberland County and 31.6600 mills for Columbia County.[283]
- 2007–08 – 30.2600 mills for Northumberland County and 18.6000 mills for Columbia County.[284]
The average yearly property tax paid by Northumberland County residents amounts to about 2.23% of their yearly income. Northumberland County ranked 1219th out of the 3143 United States counties for property taxes as a percentage of median income.[285] According to a report prepared by the Pennsylvania Department of Education, the total real estate taxes collected by all school districts in Pennsylvania rose from $6,474,133,936 in 1999-00 to $10,438,463,356 in 2008–09 and to $11,153,412,490 in 2011.[286] Property taxes in Pennsylvania are relatively high on a national scale. According to the Tax Foundation, Pennsylvania ranked 11th in the U.S. in 2008 in terms of property taxes paid as a percentage of home value (1.34%) and 12th in the country in terms of property taxes as a percentage of income (3.55%).[287]
Act 1 Index
The Act 1 of 2006 Index regulates the rates at which each school district can raise property taxes in Pennsylvania. Districts are not allowed to raise taxes above that index unless they allow voters to vote by referendum, or they seek an exception from the state Department of Education. The base index for the 2011–2012 school year is 1.4 percent, but it can be adjusted higher, depending on a number of factors, such as property values and the personal income of district residents. Act 1 included 10 exceptions: increasing pension costs, increases in special education costs, a catastrophe like a fire or flood, increasing rising health care costs for contracts in effect in 2006 or declining local tax bases. The base index is the average of the percentage increase in the statewide average weekly wage, as determined by the PA Department of Labor and Industry, for the preceding calendar year and the percentage increase in the Employment Cost Index for Elementary and Secondary Schools, as determined by the Bureau of Labor Statistics in the U.S. Department of Labor, for the previous 12-month period ending June 30. For a school district with a market value/personal income aid ratio (MV/PI AR) greater than 0.4000, its index equals the base index multiplied by the sum of .75 and its MV/PI AR for the current year.[288] With the 2011 state education budget, the General Assembly voted to end most of the Act 1 exceptions leaving only special education costs and pension costs. The cost of construction projects will go to the voters for approval via ballot referendum.[289]
The School District Adjusted Index for the Shamokin Area School District 2006–2007 through 2011–2012.[290]
|
|
For the 2017-18 budget year, Mount Carmel Area School Board once again applied for exceptions to exceed the district's Act 1 Index limit due to: escalating teacher pensions costs and rising special education costs.[300] Statewide 356 school districts adopted a resolution to not exceed their Act I index in 2017-18. In 2017-18, all Pennsylvania public school districts were required to make a 32.85% of payroll payment to the teacher’s pension fund (PSERS).[301] This was in addition to the 6.2% social security employer match payment and the Medicare match of 1.45%.[302][303]
For the 2016-17 budget year, Mount Carmel Area School Board applied for two exceptions to exceed the district's Act 1 Index limit: the rapidly escalating teachers pension costs and increasing special education costs.[304] Statewide 299 school districts adopted a resolution to not exceed their Act I index in 2016-17. In 2016-17, all Pennsylvania public school districts were required to make a 30.03% of payroll payment to the teacher’s pension fund (PSERS).[305] This was in addition to the 6.02% social security employer match payment.[302]
For the 2015–16 budget year, Mount Carmel Area School Board did not apply for any exceptions to exceed their Act 1 Index limit. For the school budget 2015–16, 310 Pennsylvania public school districts adopted a resolution certifying that tax rates would not be increased above its Act 1 Index limit. Another 187 school districts adopted a preliminary budget leaving open the option of exceeding the Index limit.[306]
For the 2014–15 budget year, Mount Carmel Area School Board did not apply for exceptions to exceed their Act 1 Index limit. For the school budget 2014–15, 316 Pennsylvania public school districts adopted a resolution certifying that tax rates would not be increased above its Act 1 Index limit. Another 181 school districts adopted a preliminary budget leaving open the option of exceeding the Index limit. Districts may apply for multiple exceptions each year. For the pension costs exception, 163 school districts received approval to exceed the Index in full, while others received a partial approval of their request. For special education costs, 104 districts received approval to exceed their tax limit. Seven Pennsylvania public school districts received an approval for the grandfathered construction debts exception.[307]
For the 2013–14 budget year, Mount Carmel Area School Board did not apply for exceptions to exceed their Act 1 Index limit. For the school budget year 2013–14, 311 Pennsylvania public school districts adopted a resolution certifying that tax rates would not be increased above their index. Another 171 school districts adopted a preliminary budget leaving open the option of exceeded the Index limit. For the pension costs exception, 169 school districts received approval to exceed the Index. For special education costs, 75 districts received approval to exceed their tax limit. Eleven Pennsylvania public school districts received an approval for grandfathered construction debts.[308]
For the 2012–13 budget year, Mount Carmel Area School Board did not apply for exceptions to exceed the Act 1 Index. For 2012–2013, 274 school districts adopted a resolution certifying that tax rates would not be increased above their index; 223 school districts adopted a preliminary budget leaving open the option of exceeded the Index limit. For the exception for pension costs, 194 school districts received approval to exceed the Index. For special education costs, 129 districts received approval to exceed the tax limit.[309]
For the 2011–12 school year, the Mount Carmel Area School Board applied for 2 exceptions to exceed the Act 1 Index: pension costs and special education costs.[310] Each year the Mount Carmel Area School Board has the option of adopting either 1) a resolution in January certifying they will not increase taxes above their index or 2) a preliminary budget in February. A school district adopting the resolution may not apply for referendum exceptions or ask voters for a tax increase above the inflation index. A specific timeline for these decisions is publisher each year by the Pennsylvania Department of Education.[311]
According to a state report, for the 2011–2012 school year budgets, 247 school districts adopted a resolution certifying that tax rates would not be increased above their index; 250 school districts adopted a preliminary budget. Of the 250 school districts that adopted a preliminary budget, 231 adopted real estate tax rates that exceeded their index. Tax rate increases in the other 19 school districts that adopted a preliminary budget did not exceed the school district’s index. Of the districts who sought exceptions 221 used the pension costs exemption and 171 sought a Special Education costs exemption. Only 1 school district sought an exemption for Nonacademic School Construction Project, while 1 sought an exception for Electoral debt for school construction.[312]
Mount Carmel Area School Board did not apply for exceptions to exceed the Act 1 index for the budgets in 2009–10, nor in 2010–11.[313][314]
In the Spring of 2010, 135 Pennsylvania school boards asked to exceed their adjusted index. Approval was granted to 133 of them and 128 sought an exception for pension costs increases.[315]
Property tax relief
In 2016, Mount Carmel Area School District approved 3,312 homestead properties received $68.[316] This was the lowest amount distributed among public school districts in Northumberland County and in the Central Susquehanna five county region which includes: Snyder County, Union County, Northumberland County, Columbia County and Montour County.
In 2009, the Homestead/Farmstead Property Tax Relief from gambling for the Mount Carmel Area School District was $76 per approved permanent primary residence. This was among the lowest amounts in the Commonwealth of Pennsylvania. In the district, 2926 property owners applied for the tax relief. The relief was subtracted from the total annual school property tax bill. Property owners apply for the relief through the county Treasurer's office. Farmers can qualify for a farmstead exemption on building used for agricultural purposes. The farm must be at least 10 contiguous acres and must be the primary residence of the owner. Farmers can qualify for both the homestead exemption and the farmstead exemption.[317]
Additionally, the Pennsylvania Property Tax/Rent Rebate program is provided for low income residents in Mount Carmel Area School District aged 65 and older; widows and widowers aged 50 and older; and people with disabilities age 18 and older. The income limit is $35,000 for homeowners. The maximum rebate for both homeowners and renters is $650. Applicants can exclude one-half (1/2) of their Social Security income, so people who make substantially more than $35,000 may still qualify for a rebate. Individuals must apply annually for the rebate.[318]
Wellness policy
Mount Carmel Area School Board established a district wellness policy in 2005.[319] The policy deals with nutritious meals served at school, the control of access to some foods and beverages during school hours, age appropriate nutrition education for all students, and physical education for students K-12. The policy is consistent with state mandates and federal legislation (P.L. 108 – 265 ). The law dictates that each school district participating in a program authorized by the Richard B. Russell National School Lunch Act (42 U.S.C. 1751 et seq) or the Child Nutrition Act of 1966 (42 U.S.C. 1771 et seq) "shall establish a local school wellness policy by School Year 2006." Most districts identified the superintendent and school foodservice director as responsible for ensuring local wellness policy implementation.[320]
The legislation placed the responsibility of developing a wellness policy at the local level so the individual needs of each district can be addressed. According to the requirements for the Local Wellness Policy, school districts must set goals for nutrition education, physical activity, campus food provision, and other school-based activities designed to promote student wellness. Additionally, districts were required to involve a broad group of individuals in policy development and to have a plan for measuring policy implementation. Districts were offered a choice of levels of implementation for limiting or prohibiting low nutrition foods on the school campus. In final implementation these regulations prohibit some foods and beverages on the school campus.[321] The Pennsylvania Department of Education required the district to submit a copy of the policy for approval.
The district offers both a free school breakfast and a free or reduced-price lunch to children in low income families. All students attending the school can eat breakfast and lunch. Children from families with incomes at or below 130 percent of the federal poverty level are provided a breakfast and lunch at no cost to the family. Children from families with incomes between 130 and 185 percent of the federal poverty level can be charged no more than 30 cents per breakfast. A foster child whose care and placement is the responsibility of the State or who is placed by a court with a caretaker household is eligible for both a free breakfast and a free lunch. Runaway, homeless and Migrant Youth are also automatically eligible for free meals.[322] The meals are partially funded with federal dollars through the United States Department of Agriculture.[323]
In 2013, the USDA issued new restrictions to foods in public schools. The rules apply to foods and beverages sold on all public school district campuses during the day. They limit vending machine snacks to a maximum of 200 calories per item. Additionally, all snack foods sold at school must meet competitive nutrient standards, meaning they must have fruits, vegetables, dairy or protein in them or contain at least 10 percent of the daily value of fiber, calcium, potassium, and Vitamin D.[324] In order to comply with the Healthy, Hunger-Free Kids Act of 2010 all US public school districts are required to raise the price of their school lunches to $2.60 regardless of the actual cost of providing the lunch.[325] In 2014, President Obama ordered a prohibition of advertisements for unhealthy foods on public school campuses during the school day.[326] The Food and Drug Administration requires that students take milk as their beverage at lunch. In accordance with this law, any student requesting water in place of milk with their lunch must present a written request, signed by a doctor, documenting the need for water instead of milk.[327]
Mount Carmel Area School District provides health services as mandated by the Commonwealth and the federal government. Nurses are available in each building to conduct annual health screenings (data reported to the PDE and state Department of Health) and to dispense prescribed medications to students during the school day. Students can be excluded from school unless they comply with all the State Department of Health’s extensive immunization mandates. School nurses monitor each pupil for this compliance.[328][329] Nurses also monitor each child's weight.
Extracurriculars
The Mount Carmel Area School District offers a variety of clubs, activities and an extensive sports program.[330] Eligibility for participation is determined by Mount Carmel Area School Board policy and in compliance with standards set by the Pennsylvania Interscholastic Athletic Association (PIAA). The Mount Carmel Area School District is a Division I member of the Pennsylvania Heartland Athletic Conference.[331] The Pennsylvania Heartland Athletic Conference is a voluntary association of 25 PIAA High Schools within the central Pennsylvania region.
By Pennsylvania law, all K-12 students in the district, including those who attend a private school, a public cyber charter school, a public charter school and those who are homeschooled, are eligible to participate in the extracurricular programs, including all athletics. They must meet the same eligibility rules as the students enrolled in the district's schools.[332]
Mount Carmel Area School District operates an indoor pool which it rents to the general public for pool parties. The district is noncompliant with state law, due to failing to post its Interscholastic Athletic Opportunities Disclosure Form on its website.
According to PA Child Abuse Recognition and Reporting Act 126 of 2014, all volunteer coaches and all those who assist in student activities, must have criminal background checks. Like all school district employees, they must also attend an anti child abuse training once every three years.[333][334][335]
Sports
Coaches receive compensation as outlined in the teachers' union contract. When athletic competition exceeds the regular season, additional compensation is paid.[336] According to Pennsylvania’s Safety in Youth Sports Act, all sports coaches, paid and volunteer, are required to annually complete the Concussion Management Certification Training and present the certification before coaching.[337] The District conducts preseason concussion testing for all athletes.
The district funds:
|
|
- Junior High School Sports
|
|
- According to PIAA directory July 2012 [338] Updated according to PIAA directory July 2014.
References
- ↑ NEWS-ITEM (June 3, 2012). "School staff salaries: Mount Carmel Area". Archived from the original on September 16, 2013. Retrieved October 9, 2015.
- ↑ MARK GILGER (January 21, 2017). "MCA board passes a preliminary budget, approves salary adjustments". NEWS-ITEM. Archived from the original on July 18, 2017. Retrieved July 9, 2017.
- ↑ National Center for Education Statistics, Common Core of Data Mount Carmel Area School District, 2017
- ↑ National Center for Education Statistics, Common Core of Data Mount Carmel Area School District, 2013
- ↑ Pennsylvania Department of Education (2016). "Mount Carmel Area School District Profile Fast Facts 2016".
- ↑ Pennsylvania Department of Education (October 4, 2013). "Mount Carmel Area School District Profile Fast Facts 2013".
- ↑ National Center for Education Statistics, Common Core of Data – Mount Carmel Area School District, 2011
- ↑ Rick Dandes, For Some, tears flow, The Daily Item, August 18, 2014
- ↑ Pennsylvania Department of Education, Enrollment and Projections by Schools District, January 2009
- ↑ MARK GILGER (January 21, 2017). "MCA board passes a preliminary budget, approves salary adjustments". NEWS-ITEM. Archived from the original on May 20, 2017. Retrieved July 9, 2017.
- ↑ Mount Carmel Area School District Administration, General Fund Budget 2015–16, June 2015
- ↑ Mount Carmel Area School District Administration, General Fund Budget 2013–14, March 27, 2013
- ↑ US Census Bureau, 2010 Census Poverty Data by Local Education Agency, 2011
- ↑ proximityone (2014). "School District Comparative Analysis Profiles".
- ↑ Pennsylvania Budget and Policy Center, Education Facts Student Poverty Concentration by LEA, 2012
- ↑ American Fact Finder, US Census Bureau, 2009
- ↑ US Census Bureau (2014). "Pennsylvania Median household income, 2006–2010 by County".
- ↑ US Census Bureau (2010). "American Fact Finder, State and County quick facts".
- ↑ US Census Bureau (September 2011). "Income, Poverty, and Health Insurance Coverage in the United States: 2010" (PDF).
- ↑ Michael Sauter & Alexander E.M. Hess (August 31, 2013). "America's most popular six-figure jobs". USA Today.
- ↑ Pennsylvania Office of the Auditor General, Mount Carmel Area School District Performance Audit report 2012, June 2012
- ↑ Justin Strawser, Six offer their own online classes, The Daily item, January 31, 2016
- ↑ PDE, Charter Schools and Cyber Charter schools 2015–16, 2015
- ↑ Pennsylvania Public School Code Governance 2010
- ↑ The Commonwealth Foundation for Public Policy Alternatives. "The Pennsylvania Project". Archived from the original on July 16, 2011. Retrieved May 20, 2010.
- ↑ Pittsburgh Business Times (April 12, 2016). "Chester County district leads statewide Honor Roll 2016".
- ↑ Pittsburgh Business Times (April 11, 2014). "Guide to Pennsylvania Schools Statewide School District Ranking 2014".
- ↑ Pittsburgh Business Times (April 10, 2015). "Guide to Pennsylvania Schools Statewide School District Ranking 2015".
- ↑ Pittsburgh Business Times (April 11, 2014). "Western Pennsylvania School GUide 2014".
- ↑ "Statewide Honor Roll Rankings 2013". Pittsburgh Business Times. April 5, 2013.
- ↑ Pittsburgh Business Times, Guide to Pennsylvania Schools – School District Ranking 2012, April 6, 2012
- ↑ Pittsburgh Business Times (April 2011). "Statewide Honor Roll Rankings information". Archived from the original on 2011-07-23.
- ↑ Pittsburgh Business Times, Statewide Honor Roll Rankings 2010, May 5, 2010
- ↑ "Three of top school districts in state hail from Allegheny County". Pittsburgh Business Times. May 23, 2007. Archived from the original on July 18, 2011.
- ↑ Pennsylvania Department of Education (May 2016). "2016-17 Opportunity Scholarship Tax Credit Program".
- ↑ Pennsylvania Department of Education (April 2014). "2014–15 List of Low Achieving Schools".
- ↑ Pennsylvania Department of Education (July 2013). "Opportunity Scholarship Tax Credit Program".
- ↑ Pennsylvania Department of community and Economic Development (2014). "Opportunity Scholarship Tax Credit Program FAQ".
- ↑ Pennsylvania Department of Education (May 2012). "Tuition rate Fiscal Year 2011–2012".
- ↑ Olsen, Laura, State list of failing schools has 53 in county, Pittsburgh Post-Gazette, July 26, 2012
- ↑ Pennsylvania Auditor General Office (October 6, 2015). "561 Academically Challenged Schools Overlooked by the Department of Education" (PDF). Archived from the original (PDF) on November 18, 2015.
- ↑ Joe Sylvester (October 7, 2015). "8 schools in Valley jilted, audit reveals". The Daily Item.
- ↑ Pennsylvania Auditor General Office (October 7, 2015). "Special Performance Audit Report – Pennsylvania Department of Education" (PDF).
- ↑ Pennsylvania Department of Education (September 21, 2012). "Mount Carmel Area School District AYP Overview 2012". Archived from the original on April 26, 2014. Retrieved November 21, 2014.
- ↑ Pennsylvania Department of Education, Pennsylvania Public School District AYP History, 2011
- ↑ Pennsylvania Department of Education, Pennsylvania Public School District AYP History 2003–2010, 2011
- ↑ Pennsylvania Department of Education, Mount Carmel Area School District Fast Facts 2016, November 14, 2016
- ↑ Pennsylvania Department of Education, Mount Carmel Area School District Fast Facts 2015, November 4, 2015
- ↑ Pennsylvania Department of Education, Mount Carmel Area School District Fast Facts 2014, November 6, 2014
- ↑ Pennsylvania Department of Education, Mount Carmel Area School District Fast Facts 2013, October 4, 2013
- ↑ Pennsylvania Department of Education (September 21, 2012). "Mount Carmel Area School District AYP Datatable 2012". Archived from the original on March 4, 2016. Retrieved October 9, 2015.
- ↑ Pennsylvania Department of Education (March 15, 2011). "New 4-year Cohort Graduation Rate Calculation Now Being Implemented".
- 1 2 Pennsylvania Department of Education (2010). "Mount Carmel Area School District Academic Achievement Report Card 2010" (PDF).
- ↑ Pennsylvania Department of Education, Mount Carmel Area School District Academic Achievement Report Card 2009, September 14, 2009
- ↑ The Times-Tribune (June 25, 2009). "County School Districts Graduation Rates 2008".
- ↑ Pennsylvania Partnerships for Children (2008). "High School Graduation rate 2007" (PDF). Archived from the original (PDF) on 2012-05-07. Retrieved 2011-01-31.
- ↑ Pennsylvania Department of Education (November 14, 2016). "Mount Carmel Area High School Fast Facts 2016".
- ↑ US News and World Report, Best High Schools, 2016
- ↑ Pennsylvania Department of Education (2015). "Highly Qualified Teacher Guidelines". Archived from the original on 2016-06-24.
- ↑ US News and World Report, Best High Schools, 2013
- ↑ National Center for Education Statistics, Common Care Data – Mount Carmel Area High School, 2010
- ↑ Pennsylvania Department of Education, Professional Qualifications of Teachers Mount Carmel Area High School, September 29, 2011
- ↑ Pennsylvania Department of Education (September 29, 2016). "2016 PSSA AND KEYSTONE Results".
- ↑ Pennsylvania Department of Education (August 2016). "Findings and Recommendations Pursuant to Act 1 of 2016" (PDF).
- ↑ Jan Murphy (October 16, 2016). "How District schools fared overall".
- ↑ Pennsylvania Department of Education (November 4, 2015). "Mount Carmel Area High School School Performance Profile 2015".
- ↑ Jan Murphy (November 4, 2015). "Report card for state's high schools show overall decline". Pennlive.com.
- ↑ Pennsylvania Department of Education (November 4, 2015). "2015 Keystone Exam School Level Data".
- ↑ Pennsylvania Department of Education (November 6, 2014). "Mount Carmel Area High School Academic Performance Data 2014".
- ↑ Evamarie Socha (November 6, 2014). "Half of Valley districts see state test scores decline". The Daily Item.
- ↑ PDE (2014). "2014 CSIU 16 region school districts/schools".
- ↑ Acting Secretary of Education Carolyn Dumaresq, Acting Secretary of Education Announces Results of 2013–14 School Performance Profile; Strong Performance in 72 Percent of Schools, November 6, 2014
- ↑ Kathy Boccella; Dylan Purcell & Kristen A. Graham (November 6, 2014). "Pa. school rankings: Downingtown STEM No. 1; Phila. falters". The Philadelphia Inquirer.
- ↑ Jan Murphy (November 6, 2014). "More Pa. school scores decline than improve, state report card shows". Pennlive.com.
- ↑ Evamarie Socha (November 6, 2014). "Half of Valley districts see state test scores decline".
- ↑ Pennsylvania Department of Education (October 4, 2013). "Mount Carmel Area High School Academic Performance Data 2013".
- ↑ Eleanor Chute & Mary Niederberger (December 11, 2013). "New assessment shows fuller picture of Pa. schools". Pittsburgh Post-Gazette.
- ↑ Pennsylvania Department of Education, Mount Carmel Area High School Academic Report Card 2012, September 21, 2012
- ↑ Pennsylvania Department of Education, Mount Carmel Area High School Academic Report Card 2011, September 29, 2011
- ↑ Pennsylvania Department of Education, Mount Carmel Area High School Academic Report Card 2010, October 20, 2010
- ↑ Pennsylvania Department of Education, Mount Carmel Area High School Academic Report Card 2009, September 14, 2009
- ↑ Pennsylvania Department of Education, Mount Carmel Area High School Academic Report Card 2008, August 15, 2008
- ↑ Pennsylvania Department of Education, Mount Carmel Area High School Academic Report Card 2007, 2007
- ↑ Pennsylvania Department of Education, Mount Carmel Area High School Academic Report Card 2006, 2006
- ↑ Pennsylvania Department of Education (2014). "State Assessment System".
- ↑ Pennsylvania Department of Education (September 21, 2012). "Mount Carmel Area School District Academic Report Card 2012" (PDF). Archived from the original (PDF) on March 4, 2016. Retrieved October 17, 2012.
- ↑ "11th grade Reading 2011 CSIU Region Ranking". September 29, 2011.
- ↑ "Central Pennsylvania IU16 Districts PSSA Math Ranking". 2009.
- ↑ Pennsylvania Department of Education, PSSA Math and Reading results by School 2007, August 2007
- ↑ "11th Grade Math CSIU16 Region Schools 2011 rank". September 29, 2011.
- ↑ Pennsylvania Department of Education. "2009 PSSAs: Reading, Math, Writing and Science Results".
- ↑ "11th Grade Science CSIU16 Region Schools 2011". September 2011.
- ↑ Pennsylvania Department of Education, Report on Science PSSA results 2008, August 15, 2008
- ↑ The Pennsylvania Basic Education/Higher Education Science and Technology Partnership, Science in Motion annual report, 2012
- ↑ Pennsylvania Department of Education (2009). "Pennsylvania College Remediation Report".
- ↑ National Center for Education Statistics, IPEDS Integrated Postsecondary Education Data System, 2008
- ↑ Pennsylvania Department of Education – Dual Enrollment Guidelines. Archived 2014-10-17 at the Wayback Machine.
- 1 2 Commonwealth of Pennsylvania (March 2010). "Pennsylvania Transfer and Articulation Agreement".
- ↑ Pennsylvania Department of Education (2010). "Dual Enrollment Guidelines". Archived from the original on 2014-10-17.
- ↑ Pennsylvania Department of Education (2009). "Pennsylvania Dual Enrollment Allocations to school districts for 2010–11".
- ↑ Pennsylvania Department of Education (2016). "SAT and AP Scores 2016".
- ↑ College Board, (2017). "SAT 2016 Total Group report Pennsylvania". Archived from the original on 2017-08-02.
- ↑ Scicchitano, Eric., SAT Split in Valley, The Daily Item, April 17, 2017
- ↑ College Board, Class of 2016 SAT Participation and Performance Data, 2017
- ↑ Pennsylvania Department of Education (2015). "SAT and AP Scores 2015".
- ↑ College Board, SAT 2015 Total Group report Pennsylvania, 2016
- ↑ PDE, School Performance profile, November 6, 2014
- ↑ College Board (2014). "2014 College-Bound Seniors State Profile Report" (PDF).
- ↑ College Board (2013). "The 2013 SAT Report on College & Career Readiness".
- ↑ Pennsylvania Department of Education (2011). "Public School SAT Scores 2011". Archived from the original on 2011-10-15.
- ↑ College Board (September 2011). "SAT Scores State By State – Pennsylvania".
- ↑ "While U.S. SAT scores dip across the board, N.J. test-takers hold steady". NJ.com. September 2011.
- ↑ The Center for Rural Pennsylvania (August 2006). "SAT Scores and Other School Data".
- ↑ PDE, School Performance Profile – Academic Performance Data – Mount Carmel Area High School, December 2013
- ↑ College Board (2014). "Exam Fees and Reductions: 2015".
- ↑ PDE (November 6, 2014). "Mount Carmel Area High School Academic performance 2014".
- ↑ PDE, Mount Carmel Area High School Academic performance 2015, November 4, 2015
- ↑ PDE, Mount Carmel Area High School Academic performance 2016, November 14, 2016
- ↑ College Board, Fees and Fee Reductions, 2016
- ↑ Bloomsburg University Administration (2013). "High School Students (ACE)".
- ↑ Pennsylvania Department of Education (October 14, 2016). "Mount Carmel Area Junior High School Fast Facts 2016".
- ↑ Pennsylvania Department of Education, Professional Qualifications of Teachers Mount Carmel Area Junior High School, November 15, 2016
- ↑ Pennsylvania Department of Education (October 4, 2013). "Mount Carmel Area Junior High School – School Fast Facts".
- ↑ Pennsylvania Department of Education, Professional Qualifications of Teachers New Oxford Middle School, October 4, 2013
- ↑ Pennsylvania Department of Education (September 29, 2016). "2016 PSSA AND KEYSTONE Results".
- ↑ PR Newswire (2016). "Department of Education Releases Statewide Results on the 2016 Pennsylvania System Of School Assessment (PSSA)".
- 1 2 Pennsylvania Department of Education (October 1, 2015). "2015 PSSA State Level Data".
- ↑ Pennsylvania Department of Education (November 6, 2014). "Mount Carmel Junior High School Academic Performance Data 2014".
- ↑ Pennsylvania Department of Education (October 4, 2013). "Mount Carmel Junior High School Academic Performance Data 2013".
- ↑ Pennsylvania Department of Education (September 21, 2012). "MOUNT CARMEL AREA Junior Senior High School AYP Overview 2012". Archived from the original on July 14, 2011. Retrieved June 15, 2011.
- ↑ Pennsylvania Department of Education, MOUNT CARMEL AREA Junior Senior High School AYP Overview, October 20, 2010
- ↑ Pennsylvania Department of Education. "IU16-PSSA 95–96 Results by School". Retrieved May 11, 2014.
- ↑ Pennsylvania Department of Education (2014). "Standards Aligned Systems".
- ↑ Pennsylvania Department of Education (2014). "State Academic Standards".
- ↑ Pennsylvania Department of Education (2014). "State Academic Standards Mathematics".
- ↑ "How is your school doing?". Pittsburgh Post-Gazette. October 15, 2012.
- ↑ "8th Grade Reading PSSA 2011 CSIU16 Region". October 2011.
- 1 2 Pennsylvania Department of Education, PSSA Math and Reading Results 2009, September 2009
- ↑ PDE, Mount Carmel Area School Academic Achievement Report Card 2012, September 21, 2012
- ↑ "8th Grade Math PSSA CSIU16 region 2011". October 2011.
- ↑ "8th Grade Mathematics PSSA 2009 Central Susquehanna Valley IU16 Region ranking". 2010. Archived from the original on 2012-09-14.
- ↑ Pennsylvania Department of Education, PSSA Results Math and Reading School 2008, September 2008
- ↑ "8th Grade Science PSSA 2011 CSIU16 Region". October 2011.
- ↑ The 2008 PSSA Science State Level Proficiency Results by Grade and State Total (Full Academic Year)
- ↑ 8th Grade Science PSSA 2008 Central Susquehanna Valley IU16 Region ranking, September 2008
- ↑ Pennsylvania Department of Education (October 14, 2016). "Mount Carmel Area Elementary School Fast Facts 2016".
- ↑ Pennsylvania Department of Education, School Performance Profile, Mount Carmel Area Elementary School Fast Facts, 2016
- ↑ Pennsylvania Department of Education (October 4, 2013). "Mount Carmel Area Elementary School Fast Facts 2013".
- ↑ Pennsylvania Department of Education, School Performance Profile, Mount Carmel Area Elementary School Fast Facts2013, October 2013
- ↑ National Center for Education Statistics, Common Core of Data – Mount Carmel Area School District, 2010
- ↑ Pennsylvania Department of Education, 2016 PSSA AND KEYSTONE Results, September 29, 2016
- ↑ Jan Murphy (September 29, 2016). "Standardized test scores show Pa. schools have more work to do". Pennlive.com.
- ↑ Pennsylvania Department of Education (October 1, 2015). "2015 PSSA School Level Data".
- ↑ Pennsylvania Department of Education (November 6, 2014). "Mount Carmel Area Elementary School Academic Performance Data 2014".
- ↑ Pennsylvania Department of Education (October 4, 2013). "Mount Carmel Area Elementary School Academic Performance Data 2013".
- ↑ Pennsylvania Department of Education, MOUNT CARMEL AREA Elementary AYP Overview 2012, September 2012
- ↑ Pennsylvania Department of Education, MOUNT CARMEL AREA Elementary AYP Overview 2011, September 2011
- ↑ Pennsylvania Department of Education, MOUNT CARMEL AREA Elementary AYP Overview, September 29, 2011
- ↑ PDE, Mount Carmel Area Elementary School Academic Achievement Report Card 2012, September 21, 2012
- ↑ Pennsylvania Department of Education, Mount Carmel Area Elementary School Academic Achievement Report Card 2011, September 29, 2011
- ↑ Pennsylvania Department of Education, Mount Carmel Area Elementary School Academic Achievement Report Card 2010, October 20, 2010
- ↑ Pennsylvania Department of Education, Mount Carmel Area School District Academic Report Card 2009, 2009
- ↑ Pennsylvania Department of Education, Mount Carmel Area School District Academic Report Card 2008, 2008
- ↑ Pennsylvania Department of Education, Mount Carmel Area School District Academic Report Card 2007, 2007
- ↑ "4th grade reading 2011 CSIU16 region rank". October 2011.
- ↑ "4th grade Science 2011 CSIU16 region". October 2011.
- ↑ "3rd grade Reading PSSA 2011 CSIU16". 2011.
- 1 2 Governor's Press Office (August 10, 2007). "Governor Rendell Announces Grants for 'Pre-K Counts' Early Childhood Initiative".
- 1 2 Pennsylvania Department of Education (2010). "Pennsylvania PreK Counts End of Year Report 2009-2010" (PDF).
- 1 2 Office of Child Development and Early Learning (2009). "Early Childhood Programs – PreK Counts".
- ↑ Pennsylvania Department of Education, Pennsylvania 2013–14 Pre-K Counts Grantees, August 1, 2013
- ↑ Pennsylvania Bureau of Special Education Services (2012–2013). "Mount Carmel Area School District Special Education Data Report LEA Performance on State Performance Plan (SPP) Targets 2012" (PDF). Archived from the original (PDF) on 2014-08-12. Retrieved 2014-07-20.
- ↑ Pennsylvania Bureau of Special Education Services (2009–2010). "Mount Carmel Area School District Special Education Data Report LEA Performance on State Performance Plan (SPP) Targets". Archived from the original on 2011-08-24.
- ↑ Gerald L. Zahorchak, D. Ed. (May 30, 2007). "House Education Committee Hearing on Governor's Proposed Increase for Accountability Block Grants Testimony for Gerald L. Zahorchak, D. Ed. Secretary, Pennsylvania Department of Education" (PDF). Archived from the original (PDF) on June 26, 2015.
- ↑ Pennsylvania Department of Education. "Pennsylvania Special Education Funding".
- ↑ Senator Patrick Browne (November 1, 2011). "Senate Education Committee Holds Hearing on Special Education Funding & Accountability". Archived from the original on July 23, 2012.
- ↑ Pennsylvania Department of Education Amy Morton, Executive Deputy Secretary (November 11, 2011). "Public Hearing: Special Education Funding & Accountability Testimony". Archived from the original on April 22, 2012.
- ↑ Baruch Kintisch Education Law Center (November 11, 2011). "Public Hearing: Special Education Funding & Accountability Testimony" (PDF). Archived from the original (PDF) on April 22, 2012.
- ↑ Pennsylvania Department of Education (July 2010). "Special Education Funding from Pennsylvania State_2010-2011".
- ↑ Pennsylvania Department of Education (2011). "Special Education Funding 2011–2012 Fiscal Year".
- ↑ Pennsylvania Department of Education (July 2010). "Gifted Students as Percentage of Total Enrollment by School District/Charter School" (PDF). Archived from the original (PDF) on 2016-03-04.
- ↑ Pennsylvania Department of Education and Pennsylvania School Board. "CHAPTER 16. Special Education For Gifted Students". Retrieved February 4, 2011.
- ↑ Pennsylvania Department of Education (March 26, 2010). "Special Education for Gifted Students Notice of Parental rights" (PDF). Archived from the original (PDF) on March 4, 2016.
- ↑ Pennsylvania General Assembly, Taxpayer Relief Act, Act 1 of the Special Session of 2006, June 27, 2006
- ↑ Pennsylvania Department of Education, Investing in Pennsylvania Students 2014, 2014
- ↑ Openpagov.org, Mount Carmel Area School District Payroll report 2013, 2014
- ↑ Pennsylvania Department of Education, Investing in Pennsylvania Students 2013, 2013
- ↑ "Mount Carmel Area School District Payroll report 2011". OpenPA Gov.org. 2013.
- ↑ Mark Gilger (September 14, 2012). "Stellar named super at Mount Carmel Area". The News Item. Archived from the original on February 21, 2014. Retrieved February 5, 2014.
- ↑ "PA. Public School Salaries". Asbury Park Press. 2009.
- ↑ Mount Carmel Area School Board (2010). "Mount Carmel Area School District Teacher Union Employment Contract 2010".
- ↑ Fenton, Jacob, Average classroom teacher salaries in Northumberland County, 2006–07. The Morning Call. Accessed March 2010.
- ↑ Teachers need to know enough is enough, PaDelcoTimes, April 20, 2010.
- ↑ Mount Carmel Area Teachers' Union Employment Contract 2009
- ↑ Legislature must act on educators' pension hole., The Patriot-News. February 21, 2010
- ↑ Fenton, Jacob., Pennsylvania School District Data: Will School Consolidation Save Money?, The Morning Call, Feb 2009.
- ↑ Pennsylvania Department of Education (2010). "2009–10 Selected Data – 2009–10 Total Expenditures per ADM".
- ↑ United States Census Bureau (2009). "States Ranked According to Per Pupil Elementary-Secondary Public School System Finance Amounts: 2008–09" (PDF).
- ↑ US Census Bureau (2009). "Total and current expenditures per pupil in fall enrollment in public elementary and secondary education, by function and state or jurisdiction: 2006–07".
- ↑ MARK GILGER (October 27, 2015). "MCASD to take out $5M loan". News Item. Archived from the original on July 17, 2017. Retrieved October 28, 2015.
- ↑ Pennsylvania Department of Education. "Fund Balances by Local Education Agency 1997 to 2008".
- ↑ Pennsylvania Department of Education, Investing in Pennsylvania Students, 2013
- ↑ Murphy, Jan., Pennsylvania's public schools boost reserves, CentreDaily Times, September 22, 2010
- ↑ Pennsylvania Auditor General (January 2010). "Mount Carmel Area School District Northumberland County, Pennsylvania Performance Audit Report".
- ↑ Pennsylvania Department of Education (May 2012). "Pennsylvania Public School District Tuition Rates".
- ↑ Pennsylvania of Community & Economic Development (2012). "Earned Income Tax". Archived from the original on 2013-09-30.
- ↑ Penn State Cooperative Extension (2010). "What are the Local Taxes in Pennsylvania?, Local Tax Reform Education Project" (PDF).
- ↑ Pennsylvania Department of Revenue (April 2010). "Personal Income Taxation Guidelines".
- ↑ John Finnerty (2013). "PA teachers pensions". CNHI Harrisburg Bureau.
- ↑ Pennsylvania Representative Todd Stephens (January 23, 2014). "LEEF Funding Chart 2014".
- ↑ JANICE BISSETT & ARNOLD HILLMAN (2006). "A Summary of the History and Financing of Education in Pennsylvania 1682- 2013" (PDF). PA Association of Rural and Small Schools. Archived from the original (PDF) on 2015-12-23.
- ↑ Nathan Benefield and James Paul Senior Policy Analyst (December 3, 2014). "School Funding Reform & Weighted Student Funding" (PDF).
- ↑ Pennsylvania General Assembly – Education Reform Commission (December 2014). "Basic Education Funding Commission Public Hearing Funding Issues related to Enrollment and Growth". Archived from the original on 2015-03-02.
- ↑ Basic Education Funding Commission, Commission minutes, 2016
- ↑ York Dispatch, Governor Wolf Signs Fair Funding Formula, June 2016
- ↑ Pennsylvania General Assembly (June 2016). "House Bill 1552, Act 35 of 2016".
- ↑ Finnerty, John (July 1, 2017). "Spending plan heads to Wolf, but fight over funding remains". The Daily Item.
- ↑ Pennsylvania Department of Education, Education Budget 2017-18, July 2017
- ↑ PDE, Special Education Funding fiscal year 2017-18, July 2017
- ↑ PA Office of Budget (July 2016). "Commonwealth 2016-17 Enacted Budget Line-Item Appropriations" (PDF).
- ↑ Charles Thompson (June 30, 2017). "Pennsylvania state lawmakers start chewing into $32 billion, agreed-to budget proposal". Pennlive.com.
- ↑ Pennsylvania Department of Education, Education Budget 2016-17, July 2016
- ↑ PDE, Special Education Funding fiscal year 2016-17, July 2017
- ↑ PA Office of Budget, Commonwealth 2016-17 Enacted Budget Line-Item Appropriations, July 2016
- ↑ Jan Murphey (January 4, 2016). "Here's the payout your school district gets from the partial 2015–16 state budget". Pennlive.com.
- ↑ Jennifer Wakeman (January 4, 2016). "Harrisburg releases $3.3 billion in delayed funds".
- ↑ Pennsylvania General Assembly (June 26, 2015). "Basic Education Funding Commission".
- ↑ Jan Murphy (January 6, 2016). "School funding distribution gives rise to new battle between Wolf, GOP lawmakers". PennLive.com.
- ↑ Pennsylvania Department of Education (January 2016). "Summary of State Appropriations for Education 2015–2016 Fiscal Year Education Budget".
- ↑ Pennsylvania Department of Education, EdBudget 2015–16 BEF, April 6, 2016
- ↑ PDE (July 7, 2014). "Enacted Education Budget 2014–2015".
- ↑ Pennsylvania Department of Education, 2014–15 Enacted Education Budget Fast Facts, July 14, 2014
- ↑ Democrat Appropriations Committee, Report on Education funding by LEA, July 2, 2013
- ↑ Sam Wood & Brian X. McCrone (January 29, 2014). "Montgomery County lawmaker proposes using Pa. horse racing funds for education". The Philadelphia Inquirer.
- ↑ Pennsylvania Office of the Budget, 2013–14 State Budget Highlights, 2013
- ↑ Senator Jake Corman (June 28, 2012). "Pennsylvania Education funding by Local School District" (PDF). Archived from the original (PDF) on July 30, 2012.
- ↑ Pennsylvania General Assembly Sen Jake Corman (June 29, 2012). "SB1466 of 2012 General Fund Appropriation".
- ↑ Pennsylvania Department ofEducation (July 2011). "Pennsylvania 2011–2012 Estimated Basic Education Funding".
- ↑ PA Senate Appropriations Committee (June 28, 2011). "School District 2011–12 funding Report". Archived from the original on October 8, 2014.
- ↑ Pennsylvania Department of Education (June 30, 2011). "Basic Education Funding 2011–2012 Fiscal Year".
- ↑ Pennsylvania House Appropriations Committee (June 2010). "PA Basic Education Funding-Printout2 2010–2011". Archived from the original on 2014-10-08.
- ↑ Office of the Budget (February 2010). "Pennsylvania Budget Proposal 2010".
- ↑ Pennsylvania Department of Education Funding Report by LEA October 2009.
- ↑ Pennsylvania Department of Education 2009–2010 Funding Report by LEA October 2009.
- ↑ Pennsylvania Office of Budget (February 2009). "Governor's Budget Proposal 2009 Pennsylvania Department of Education Budget Proposal 2009".
- ↑ Pennsylvania Department of Education (2010). "ACCOUNTABILITY BLOCK GRANT Awards". Archived from the original on 2013-10-15.
- ↑ Pennsylvania Department of Education (2010). "PA-PACT Information".
- ↑ Pennsylvania Department of Education (2010). "2009–2010 Accountability Block Grant Mid-year Report" (PDF). Archived from the original (PDF) on 2011-09-18.
- ↑ Pennsylvania Department of Education (2013). "Passport for Learning Block Grant".
- ↑ Pennsylvania Department of Education, Science: It’s Elementary Grantees Students in 143 Schools Benefit from Intensive Science Curriculum, July 22, 2008
- ↑ Patricia Vathis Pennsylvania Department of Education, Grants and Subsidies Science: It’s Elementary, 2006
- ↑ Pennsylvania Department of Education, 2010 – 2011 Science: It’s Elementary Application Guidelines, July 2010
- ↑ Pennsylvania Department of Education, Governor Rendell Commends Teachers for Enhancing Science Education in Pennsylvania, August 10, 2006
- ↑ Pennsylvania Auditor General (2008-12-22). "Special Performance Audit Classrooms For the Future grants" (PDF).
- ↑ Pennsylvania Department of Education, Educational Assistance Program Funding 2010–2011 Fiscal Year, January 2011
- ↑ PDE, Pennsylvania Pre-K Counts Grantees, 2011–12, May 2012
- ↑ PDE, Pennsylvania 2013–14 Pre-K Counts Grantees, 2013
- ↑ CAIU 15 (2007). "Project 720". Archived from the original on 2015-06-26.
- ↑ PSEA (2006). "Project 720 PDE Education Improvement Initiative Series" (PDF). Archived from the original (PDF) on 2016-03-04.
- ↑ Pennsylvania Department of Education (2007). "Transforming Pennsylvania High Schools".
- ↑ Robert Hayes Postupac, PROJECT 720: A CASE STUDY OF HIGH SCHOOL REFORM, University of Pittsburgh, 2011
- ↑ PA Office of the Budget, 2011–12 Budget General Fund – State Appropriations, June 28, 2011
- ↑ Department of Environmental Protection (2014). "Environmental Education Grants".
- ↑ Pennsylvania Department of Environmental Protection (April 22, 2013). "Governor Corbett Awards 92 Grants for Environmental Education and Stewardship".
- ↑ Pennsylvania Department of Education (May 23, 2012). "Pennsylvania Awards $36.1 Million to Strengthen Literacy Programs".
- ↑ Pennsylvania Department of Education Press Office (October 17, 2013). "Acting Secretary of Education Says Hybrid Learning Benefits Students; Highlights Success of First-Year Pilot Program".
- ↑ Northumberland County ARRA FUNDING Report. Accessed April 2010
- ↑ "School stimulus money". Pittsburgh Post-Gazette. March 12, 2009.
- ↑ "Pennsylvania Department of Education". Retrieved 22 February 2017.
- ↑ Governor's Press Office release (January 20, 2010). "Pennsylvania's 'Race to the Top' Fueled by Effective Reforms, Strong Local Support,".
- ↑ Governor's Press Office. (January 20, 2010). "Pennsylvania's 'Race to the Top' Fueled by Effective Reforms, Strong Local Support,".
- ↑ U.S. Department of Education (March 29, 2010). "Race to the Top Fund".
- ↑ Pennsylvania Department of Education. "Common Cents program – Making Every Dollar Count". Retrieved November 11, 2011.
- ↑ PDE (November 2016). "Finances RE Tax Rates 2016–17".
- ↑ Pennsylvania Department of Education (2004). "Act 511 Tax Report".
- ↑ State Tax Equilazation Board (2011). "State Tax Equilization Board about us".
- ↑ Pennsylvania Department of Education (2014). "Real Estate Tax Rates by School District 2014–15 Real Estate Mills".
- ↑ Pennsylvania Department of Education (June 22, 2012). "$16M budget adopted with no tax hikes". Archived from the original on January 30, 2013.
- ↑ Pennsylvania Department of Education, Pennsylvania School District Real Estate Tax Rates 2011–2012 by County and district, 2011
- ↑ Pennsylvania Department of Education, Real Estate Tax Millage by School District, 2010
- ↑ Pennsylvania Department of Education, Real Estate Tax Millage by School District, 2009
- ↑ AllBusiness.com (Jun 17, 2010). "SASB says no to tax increase, passes other budgets".
- ↑ Pennsylvania Department of Education, Pennsylvania School District Real Estate Tax Rates 2008–09, 2008
- ↑ Pennsylvania Department of Education, Real Estate Tax Millage by School District, 2008
- ↑ Tax-rates.org., The 2013 Tax Resource County Property Taxes 2012, 2012
- ↑ Pennsylvania Department of Education, Pennsylvania School Finances – Summaries of Annual Financial Report Data 2010–11, 2011
- ↑ New Census Data on Property Taxes on Homeowners, Tax Foundation, September 22, 2009.
- ↑ Pennsylvania Department of Education 2010–11 Act 1 of 2006 Referendum Exception Guidelines.
- ↑ Pittsburgh Post-Gazette (July 28, 2011). "Law could restrict school construction projects". Pittsburgh Post-Gazette.
- ↑ Pennsylvania Department of Education (May 2011). "Special Session Act 1 of 2006 School District Adjusted Index for 2006–2007 through 2011–2012".
- ↑ "Index Calculation Required by the Taxpayer Relief Act". Sep 18, 2010.
- ↑ Pennsylvania Department of Education. "Financial Data Elements".
- ↑ Pennsylvania Department of Education, Special Session Act 1 Adjusted Index 2013–14, May 2012
- ↑ Pennsylvania Department of Education, 2014–2015 School District Adjusted Index, September 2013
- ↑ Pennsylvania Department of Education, 2015–2016 School District Adjusted Index, September 2014
- ↑ Pennsylvania Department of Education. "2016–2017 School District Adjusted Index, September 5, 2015".
- ↑ Pennsylvania Department of Education (205). "Property Tax Relief".
- ↑ PA Department of Education (September 10, 2016). "Index Calculation Required by Special Session Act 1 of 2006".
- ↑ Pennsylvania Department of Education (2016). "2017–18 School District Adjusted Index Listing".
- ↑ Pennsylvania Department of Education (April 2016). "Report on Referendum Exceptions For School Year 2016-2017".
- ↑ PSERS (December 10, 2015). "Fiscal Year 2016/2017 Employer Contribution Rate" (PDF).
- 1 2 USA IRS (December 14, 2016). "Understanding Employment Taxes".
- ↑ Pennsylvania School Employee Retirement System (2017). "PSERS Budget Report 2017-18" (PDF).
- ↑ Pennsylvania Department of Education (April 2016). "Report on Referendum Exceptions For School Year 2016-2017".
- ↑ PSERS (December 10, 2015). "Fiscal Year 2016/2017 Employer Contribution Rate" (PDF).
- ↑ Pennsylvania Department of Education (April 2015). "Taxpayer Relief Act Special Session Act 1 of 2006 Report on Referendum Exceptions For School Year 2015–2016" (PDF). Archived from the original (PDF) on 2016-03-04.
- ↑ Pennsylvania Department of Education (April 30, 2014). "Report on Referendum Exceptions For School Year 2014–2015".
- ↑ Pennsylvania Department of Education, Report on Referendum Exceptions For School Year 2013–2014, April 2013
- ↑ Pennsylvania Department of Education, Report on Referendum Exceptions For School Year 2012–2013, March 30, 2012
- ↑ Pennsylvania Department of Education (April 2011). "SS Act1 Report on Exceptions requested awarded 2011–2012". Archived from the original on 2014-05-04.
- ↑ Pennsylvania Department of Education (2011). "Special Session Act 1 of 2006 the Taxpayer Relief Act information".
- ↑ Pennsylvania Department of Education (April 2011). "Report on Exceptions".
- ↑ Pennsylvania Department of Education (April 2010). "Pennsylvania SSAct1_Act1 Exceptions Report 2010-2011 April 2010". Archived from the original on 8 October 2014.
- ↑ Pennsylvania Department of Education (April 2009). "Pennsylvania SSAct1 Exception requests Report_2009-2010_May 2009". Archived from the original on 2013-10-15.
- ↑ Scarcella, Frank & Pursell, Tricia, (May 25, 2010). "Local school tax assessments exceed state averages". The Daily Item.
- ↑ Pennsylvania Department of Education (May 1, 2016). "2016–17 Estimated State Property Tax Relief per Homestead".
- ↑ Pennsylvania Gaming Control Board (2014). "Gaming Benefits for Pennsylvanians".
- ↑ PA Department of Revenue (2016). "PROPERTY TAX/RENT REBATE PROGRAM".
- ↑ Mount Carmel Area School Board (July 2005). "Student Nutrition/Wellness Policy" (PDF).
- ↑ Probart C, McDonnell E, Weirich JE, Schilling L, Fekete V (September 2008). "Statewide assessment of local wellness policies in Pennsylvania public school districts". J Am Diet Assoc. 108 (9): 1497–502. doi:10.1016/j.jada.2008.06.429. PMID 18755322.
- ↑ Pennsylvania Department of Education – Division of Food and Nutrition (July 2008). "Nutrition Standards for Competitive Foods in Pennsylvania Schools for the School Nutrition Incentive".
- ↑ USDA, Child Nutrition Programs – Eligibility Manual for School Meals, 2012
- ↑ Pennsylvania Hunger Action Center, The Pennsylvania School Breakfast Report Card, 2009
- ↑ USDA, Child Nutrition Programs, June 27, 2013
- ↑ United States Department of Agriculture (2011). "Food and Nutrition Service Equity in School Lunch Pricing Fact Sheet" (PDF). Archived from the original (PDF) on 2013-09-22.
- ↑ Denver Nicks (February 25, 2014). "White House Sets New Limits on Junk Food Ads in Schools". Time Magazine.
- ↑ USDA Food and Nutrition Service (2014). "School Meals FAQ".
- ↑ Pennsylvania State Department of Health (2010). "Pennsylvania Bulletin Doc. No. 10-984 School Immunizations; Communicable and Noncommunicable Diseases".
- ↑ Pennsylvania Department of Health (2014). "School Immunization Requirements".
- ↑ Bernard Stellar (2013). "Annual Financial Report, PDE-2057 Mount Carmel Area School District" (PDF).
- ↑ "Pennsylvania Heartland Athletic Conference handbook 2010–11" (PDF). Archived from the original (PDF) on 2012-03-04.
- ↑ Pennsylvania Office of the Governor Press Release (November 10, 2005). "Home-Schooled, Charter School Children Can Participate in School District Extracurricular Activities".
- ↑ Eleanor Chute., New Pa. law expands clearance requirements for school volunteers, employees, Pittsburgh Post-Gazette, December 15, 2014
- ↑ Pennsylvania General Assembly (2014). "ACT 126 – Child Abuse Recognition and Reporting Act".
- ↑ Ali Stevens., Child Protective Services Law impacts schools, WKOK.com 1070AM, January 6, 2015
- ↑ Mount Carmel Area School Board, Mount Carmel Area School District Teacher Union Contract, 2014
- ↑ PA General Assembly (July 1, 2012). "Senate Bill 200 of Session 2011 Safety in Youth Sports Act".
- ↑ Pennsylvania Interscholastic Athletics Association (2012). "PIAA School Directory".
External links
- Mount Carmel Area School District
- Central Susquehanna Intermediate Unit CSIU16
- Columbia-Montour Area Vocational-Technical School
- SusQCyber Charter School
Northumberland County, Pennsylvania Schools | |||||||||||||||||||||
|---|---|---|---|---|---|---|---|---|---|---|---|---|---|---|---|---|---|---|---|---|---|
| |||||||||||||||||||||
| |||||||||||||||||||||
Columbia County, Pennsylvania Schools | |||||||||||||||||
|---|---|---|---|---|---|---|---|---|---|---|---|---|---|---|---|---|---|
| |||||||||||||||||
| |||||||||||||||||