Mississippi's 2nd congressional district
| Mississippi's 2nd congressional district | |
|---|---|
.tif.png) Mississippi's 2nd congressional district since January 3, 2013 | |
| Current Representative | Bennie Thompson (D–Bolton) |
| Area | 14,519.68 sq mi (37,605.8 km2) |
| Distribution |
|
| Population (2006) | 711,164 |
| Median income | 26,894 |
| Ethnicity |
|
| Cook PVI | D+14[1] |
Mississippi's 2nd congressional district (MS-2) is the only majority-black district in the U.S. state, covering much of Western Mississippi. The district includes most of Jackson, the riverfront cities of Greenville and Vicksburg and the interior market cities of Clarksdale, Greenwood and Clinton. The district is approximately 275 miles (443 km) long, 180 miles (290 km) wide and borders the Mississippi River; it encompasses much of the Mississippi Delta, and a total of 15 counties and parts of several others.
The district is home to four of Mississippi's eight public four-year colleges and universities: Alcorn State University in Lorman; Delta State University in Cleveland; Jackson State University in Jackson; and Mississippi Valley State University in Itta Bena, a few miles west of Greenwood. All except Delta State are HBCUs and are members of the Southwestern Athletic Conference.
From statehood to the election of 1846, Mississippi elected representatives at-large statewide on a general ticket. This favored candidates who could command a majority of the voters, then consisting mostly of white men of property.
Following Reconstruction, the Democratic Party regained control of the state legislature and worked to reduce Republican voting strength in the state. It redefined congressional districts, creating a 'shoestring' congressional district running the length of the Mississippi River and taking in the black-majority (then Republican) areas of the Mississippi Delta. By this gerrymandering, they created five other districts with white majorities.[2]
Election campaigns were often accompanied by fraud and violence as Democrats tried to reduce black Republican voting. Finally, the Democratic-dominated legislature passed a new constitution in 1890, with barriers to voter registration and other measures that effectively disenfranchised most blacks and many poor whites for decades, subduing the Republican and Populist movements of the late 19th century.[3]
The legislature has redefined congressional districts over the years to reflect population changes in the state. Districts 5 through 8 were reallocated to the 1st, 3rd and 4th. The 2nd, bounded by the Mississippi River on the west, continues to have a black-majority population. Since the 20th-century realignment of political parties in the South following passage of the Civil Rights Act of 1964 and Voting Rights Act of 1965, which provided federal oversight and enforcement to protect voting, African-American residents here have consistently supported Democratic party candidates. Most white conservatives have shifted into the Republican Party and dominate the legislature.
The district's current Representative is Democrat Bennie Thompson.
Election results
2016
| Party | Candidate | Votes | % | |
|---|---|---|---|---|
| Democratic | Bennie Thompson (inc.) | 192,343 | 67.1 | |
| Republican | John Bouie II | 83,542 | 29.1 | |
| Independent | Troy Ray | 6,918 | 2.4 | |
| Reform | Johnny McLeod | 3,823 | 1.3 | |
| Total votes | 286,626 | 100.00 | ||
| Democratic hold | ||||
2014
| Party | Candidate | Votes | % | |
|---|---|---|---|---|
| Democratic | Bennie Thompson (inc.) | 100,688 | 67.7 | |
| Independent | Troy Ray | 36,465 | 24.5 | |
| Reform | Shelley Shoemake | 11,493 | 7.7 | |
| Total votes | 148,646 | 100.00 | ||
| Democratic hold | ||||
2012
| Party | Candidate | Votes | % | |
|---|---|---|---|---|
| Democratic | Bennie Thompson (inc.) | 214,978 | 67.13 | |
| Republican | Bill Marcy | 99,160 | 30.96 | |
| Independent | Cobby Williams | 4,605 | 1.44 | |
| Reform | Lajena Williams | 1,501 | 0.47 | |
| Total votes | 320,244 | 100.00 | ||
| Democratic hold | ||||
2010
| Party | Candidate | Votes | % | |
|---|---|---|---|---|
| Democratic | Bennie Thompson (inc.) | 105,327 | 61.47 | |
| Republican | Bill Marcy | 64,499 | 37.64 | |
| Reform | Ashley Norwood | 1,530 | 0.89 | |
| Total votes | 171,356 | 100.00 | ||
| Democratic hold | ||||
2008
| Party | Candidate | Votes | % | ± | |
|---|---|---|---|---|---|
| Democratic | Bennie G. Thompson | 201,606 | 69.05 | +4.78 | |
| Republican | Richard Cook | 90,364 | 30.95 | -4.78 | |
| Turnout | 291,970 | ||||
| Majority | 111,242 | 38.10 | |||
2006
| Party | Candidate | Votes | % | ± | |
|---|---|---|---|---|---|
| Democratic | Bennie G. Thompson | 100,168 | 64.27 | +5.89 | |
| Republican | Yvonne R. Brown | 55,672 | 35.73 | -4.91 | |
| Turnout | 155,832 | ||||
| Majority | 44,496 | 28.55 | |||
2004
| Party | Candidate | Votes | % | ± | |
|---|---|---|---|---|---|
| Democratic | Bennie G. Thompson | 154,626 | 58.38 | +3.24 | |
| Republican | Clinton B. LeSueur | 107,647 | 40.64 | -2.11 | |
| Reform | Shawn O'Hara | 2,596 | 0.98 | -1.12 | |
| Turnout | 264,869 | ||||
| Majority | 46,979 | 17.74 | |||
2002
| Party | Candidate | Votes | % | ± | |
|---|---|---|---|---|---|
| Democratic | Bennie G. Thompson | 89,913 | 55.14 | -9.93 | |
| Republican | Clinton B. LeSueur | 69,711 | 42.75 | +11.54 | |
| Reform | Lee F. Dilworth | 3,426 | 2.10 | +0.87 | |
| Turnout | 163,050 | ||||
| Majority | 20,202 | 12.39 | |||
2000
| Party | Candidate | Votes | % | ± | |
|---|---|---|---|---|---|
| Democratic | Bennie G. Thompson | 112,777 | 65.07 | ||
| Republican | Hardy Caraway | 54,090 | 31.21 | ||
| Libertarian | William G. Chipman | 4,305 | 2.48 | ||
| Reform | Lee F. Dilworth | 2,135 | 1.23 | ||
| Turnout | 173,307 | ||||
| Majority | 58,687 | 33.86 | |||
List of representatives
| Name | Years of Service | Party | Notes | |
|---|---|---|---|---|
| District created March 4, 1845 | ||||
 |
March 4, 1845 - March 3, 1847 | Democratic | ||
 |
March 4, 1847 - March 3, 1851 | Democratic | ||
 |
March 4, 1851 - March 3, 1853 | Unionist | ||
|
March 4, 1853 - March 3, 1855 | Democratic | ||
|
March 4, 1855 - March 3, 1857 | Democratic | ||
 |
March 4, 1857 - January 12, 1861 | Democratic | Withdrew | |
| Civil War and Reconstruction | ||||
 |
February 23, 1870 - March 3, 1873 | Republican | ||
|
March 4, 1873 - March 3, 1875 | Republican | ||
 |
March 4, 1875 - March 3, 1877 | Independent Republican | ||
 |
March 4, 1877 - March 3, 1883 | Democratic | ||
| Vacant | March 4, 1883 - June 25, 1884 | |||
 |
June 25, 1884 - March 3, 1885 | Independent | Seated after contested election with Van H. Manning | |
|
March 4, 1885 - March 3, 1891 | Democratic | ||
.jpg) |
March 4, 1891 - March 3, 1897 | Democratic | ||
 |
March 4, 1897 - May 31, 1898 | Democratic | Appointed U.S. Senator | |
| Vacant | May 31, 1898 - July 5, 1898 | |||
 |
July 5, 1898 - March 3, 1911 | Democratic | ||
 |
March 4, 1911 - March 3, 1921 | Democratic | ||
.jpg) |
March 4, 1921 - March 3, 1929 | Democratic | ||
.jpg) |
March 4, 1929 - September 28, 1941 | Democratic | Elected to U.S. Senate | |
| Vacant | September 28, 1941 - November 4, 1941 | |||
 |
November 4, 1941 - January 3, 1973 | Democratic | Redistricted to the 1st district | |
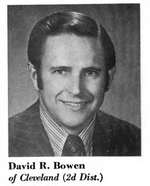 |
January 3, 1973 - January 3, 1983 | Democratic | ||
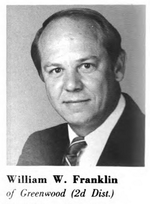 |
January 3, 1983 - January 3, 1987 | Republican | ||
 |
January 3, 1987 - January 22, 1993 | Democratic | Resigned after being confirmed as United States Secretary of Agriculture | |
| Vacant | January 22, 1993 - April 13, 1993 | |||
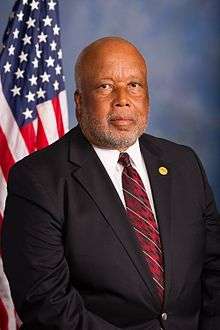 |
April 13, 1993–Present | Democratic | Incumbent | |
Historical district boundaries
See also
References
- ↑ "Partisan Voting Index – Districts of the 115th Congress" (PDF). The Cook Political Report. April 7, 2017. Retrieved April 7, 2017.
- ↑ Eric Foner, Reconstruction, 1863-1877, New York: Perennial Classics, p. 590.
- ↑ Michael Perman, Struggle for Mastery: Disfranchisement in the South, 1888-1908 (2000), ch 4.
- Martis, Kenneth C. (1989). The Historical Atlas of Political Parties in the United States Congress. New York: Macmillan Publishing Company.
- Martis, Kenneth C. (1982). The Historical Atlas of United States Congressional Districts. New York: Macmillan Publishing Company.
- Congressional Biographical Directory of the United States 1774–present
Coordinates: 33°10′35″N 90°21′03″W / 33.17639°N 90.35083°W