Microarray analysis techniques
Microarray analysis techniques are used in interpreting the data generated from experiments on DNA, RNA, and protein microarrays, which allow researchers to investigate the expression state of a large number of genes - in many cases, an organism's entire genome - in a single experiment. Such experiments can generate very large amounts of data, allowing researchers to assess the overall state of a cell or organism. Data in such large quantities is difficult - if not impossible - to analyze without the help of computer programs.
Introduction
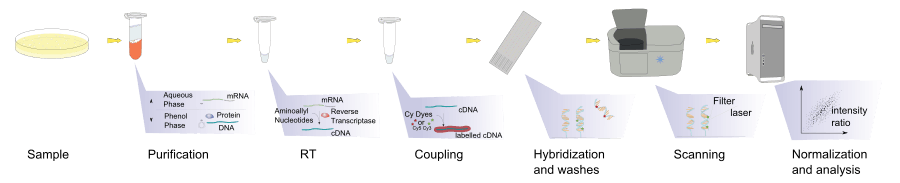
Microarray data analysis is the final step in reading and processing data produced by a microarray chip. Samples undergo various processes including purification and scanning using the microchip, which then produces a large amount of data that requires processing via computer software. It involves several distinct steps, as outlined in the image below. Changing any one of the steps will change the outcome of the analysis, so the MAQC Project[1] was created to identify a set of standard strategies. Companies exist that use the MAQC protocols to perform a complete analysis.[2]
Techniques
_(6009042166).jpg)
Most microarray manufacturers, such as Affymetrix and Agilent,[3] provide commercial data analysis software alongside their microarray products. There are also open source options that utilize a variety of methods for analyzing microarray data.
Aggregation and normalization
Comparing two different arrays or two different samples hybridized to the same array generally involves making adjustments for systematic errors introduced by differences in procedures and dye intensity effects. Dye normalization for two color arrays is often achieved by local regression. LIMMA provides a set of tools for background correction and scaling, as well as an option to average on-slide duplicate spots.[4] A common method for evaluating how well normalized an array is, is to plot an MA plot of the data. MA plots can be produced using programs and languages such as R, MATLAB, and Excel.
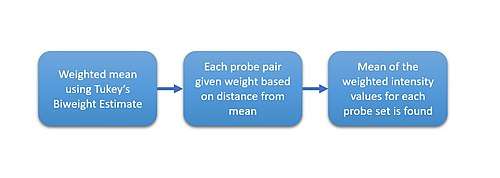
Raw Affy data contains about twenty probes for the same RNA target. Half of these are "mismatch spots", which do not precisely match the target sequence. These can theoretically measure the amount of nonspecific binding for a given target. Robust Multi-array Average (RMA) [5] is a normalization approach that does not take advantage of these mismatch spots, but still must summarize the perfect matches through median polish.[6] The median polish algorithm, although robust, behaves differently depending on the number of samples analyzed.[7] Quantile normalization, also part of RMA, is one sensible approach to normalize a batch of arrays in order to make further comparisons meaningful.
The current Affymetrix MAS5 algorithm, which uses both perfect match and mismatch probes, continues to enjoy popularity and do well in head to head tests.[8]
Factor Analysis for Robust Microarray Summarization (FARMS)[9] is a model-based technique for summarizing array data at perfect match probe level. It is based on a factor analysis model for which a Bayesian maximum a posteriori method optimizes the model parameters under the assumption of Gaussian measurement noise. According to the Affycomp benchmark[10] FARMS outperformed all other summarizations methods with respect to sensitivity and specificity.
Identification of significant differential expression
Many strategies exist to identify array probes that show an unusual level of over-expression or under-expression. The simplest one is to call "significant" any probe that differs by an average of at least twofold between treatment groups. More sophisticated approaches are often related to t-tests or other mechanisms that take both effect size and variability into account. Curiously, the p-values associated with particular genes do not reproduce well between replicate experiments, and lists generated by straight fold change perform much better.[11][12] This represents an extremely important observation, since the point of performing experiments has to do with predicting general behavior. The MAQC group recommends using a fold change assessment plus a non-stringent p-value cutoff, further pointing out that changes in the background correction and scaling process have only a minimal impact on the rank order of fold change differences, but a substantial impact on p-values.
Pattern recognition
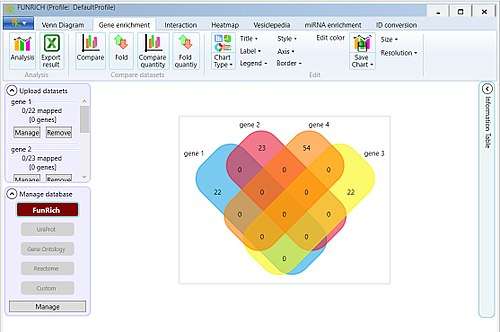
Commercial systems for gene network analysis such as Ingenuity[13] and Pathway studio[14] create visual representations of differentially expressed genes based on current scientific literature. Non-commercial tools such as FunRich,[15] GenMAPP and Moksiskaan also aid in organizing and visualizing gene network data procured from one or several microarray experiments. A wide variety of microarray analysis tools are available through Bioconductor written in the R programming language. The frequently cited SAM module and other microarray tools[16] are available through Stanford University. Another set is available from Harvard and MIT.[17]
Specialized software tools for statistical analysis to determine the extent of over- or under-expression of a gene in a microarray experiment relative to a reference state have also been developed to aid in identifying genes or gene sets associated with particular phenotypes. One such method of analysis, known as Gene Set Enrichment Analysis (GSEA), uses a Kolmogorov-Smirnov-style statistic to identify groups of genes that are regulated together.[18] This third-party statistics package offers the user information on the genes or gene sets of interest, including links to entries in databases such as NCBI's GenBank and curated databases such as Biocarta[19] and Gene Ontology. Protein complex enrichment analysis tool (COMPLEAT) provides similar enrichment analysis at the level of protein complexes.[20] The tool can identify the dynamic protein complex regulation under different condition or time points. Related system, PAINT[21] and SCOPE[22] performs a statistical analysis on gene promoter regions, identifying over and under representation of previously identified transcription factor response elements. Another statistical analysis tool is Rank Sum Statistics for Gene Set Collections (RssGsc), which uses rank sum probability distribution functions to find gene sets that explain experimental data.[23] A further approach is contextual meta-analysis, i.e. finding out how a gene cluster responds to a variety of experimental contexts. Genevestigator is a public tool to perform contextual meta-analysis across contexts such as anatomical parts, stages of development, and response to diseases, chemicals, stresses, and neoplasms.
Significance analysis of microarrays (SAM)
Significance analysis of microarrays (SAM) is a statistical technique for determining whether changes in gene expression are statistically significant. It was established in 2001 by Virginia Tusher, Robert Tibshirani and Gilbert Chu, and is distributed in an R-package by Stanford University.
SAM identifies statistically significant genes by carrying out gene specific t-tests and computes a statistic dj for each gene j, which measures the strength of the relationship between gene expression and a response variable.[24][25][26] This analysis uses non-parametric statistics, since the data may not follow a normal distribution. The response variable describes and groups the data based on experimental conditions. In this method, repeated permutations of the data are used to determine if the expression of any gene is significant related to the response. The use of permutation-based analysis accounts for correlations in genes and avoids parametric assumptions about the distribution of individual genes. This is an advantage over other techniques (e.g., ANOVA and Bonferroni correction), which assume equal variance and/or independence of genes.[27]
The following equation represents the algorithm used by SAM:

where is the linear regression coefficient of gene , is the standard error of , and is a constant chosen to minimize the coefficient of variation of . is equal to the expression levels (x) for gene i under y experimental conditions.


Error correction and quality control
Quality control
Entire arrays may have obvious flaws detectable by visual inspection, pairwise comparisons to arrays in the same experimental group, or by analysis of RNA degradation.[28] Results may improve by removing these arrays from the analysis entirely.
Background correction
Depending on the type of array, signal related to nonspecific binding of the fluorophore can be subtracted to achieve better results. One approach involves subtracting the average signal intensity of the area between spots. A variety of tools for background correction and further analysis are available from TIGR,[29] Agilent (GeneSpring),[30] and Ocimum Bio Solutions (Genowiz).[31]
Spot filtering
Visual identification of local artifacts, such as printing or washing defects, may likewise suggest the removal of individual spots. This can take a substantial amount of time depending on the quality of array manufacture. In addition, some procedures call for the elimination of all spots with an expression value below a certain intensity threshold.
See also
References
- ↑ Dr. Leming Shi, National Center for Toxicological Research. "MicroArray Quality Control (MAQC) Project". U.S. Food and Drug Administration. Retrieved 2007-12-26.
- ↑ "GenUs BioSystems - Services - Data Analysis". Retrieved 2008-01-02.
- ↑ "Agilent | DNA Microarrays". Archived from the original on December 22, 2007. Retrieved 2008-01-02.
- ↑ "LIMMA Library: Linear Models for Microarray Data". Retrieved 2008-01-01.
- ↑ Irizarry, RA; Hobbs, B; Collin, F; Beazer-Barclay, YD; Antonellis, KJ; Scherf, U; Speed, TP (2003). "Exploration, normalization, and summaries of high density oligonucleotide array probe level data". Biostatistics. 4 (2): 249–64. doi:10.1093/biostatistics/4.2.249. PMID 12925520.
- ↑ Bolstad BM, Irizarry RA, Astrand M, Speed TP (2003). "A comparison of normalization methods for high density oligonucleotide array data based on variance and bias". Bioinformatics. 19 (2): 185–93. doi:10.1093/bioinformatics/19.2.185. PMID 12538238.
- ↑ Giorgi FM, Bolger AM, Lohse M, Usadel B (2010). "Algorithm-driven Artifacts in median polish summarization of Microarray data". BMC Bioinformatics. 11: 553. doi:10.1186/1471-2105-11-553. PMC 2998528. PMID 21070630.
- ↑ Lim WK, Wang K, Lefebvre C, Califano A (2007). "Comparative analysis of microarray normalization procedures: effects on reverse engineering gene networks". Bioinformatics. 23 (13): i282–8. doi:10.1093/bioinformatics/btm201. PMID 17646307.
- ↑ Hochreiter S, Clevert DA, Obermayer K (2006). "A new summarization method for affymetrix probe level data". Bioinformatics. 22 (8): 943–949. doi:10.1093/bioinformatics/btl033. PMID 16473874.
- ↑ http://affycomp.jhsph.edu/
- ↑ Shi L, Reid LH, Jones WD, et al. (2006). "The MicroArray Quality Control (MAQC) project shows inter- and intraplatform reproducibility of gene expression measurements". Nat. Biotechnol. 24 (9): 1151–61. doi:10.1038/nbt1239. PMC 3272078. PMID 16964229.
- ↑ Guo L, Lobenhofer EK, Wang C, et al. (2006). "Rat toxicogenomic study reveals analytical consistency across microarray platforms". Nat. Biotechnol. 24 (9): 1162–9. doi:10.1038/nbt1238. PMID 17061323.
- ↑ "Ingenuity Systems". Retrieved 2007-12-31.
- ↑ "Ariadne Genomics: Pathway Studio". Retrieved 2007-12-31.
- ↑ "FunRich: Functional Enrichment Analysis". Retrieved 2014-09-09.
- ↑ ["Significance Analysis of Microarrays". Retrieved 2007-12-31. ]
- ↑ "Software - Broad". Retrieved 2007-12-31.
- ↑ Subramanian A, Tamayo P, Mootha VK, et al. (2005). "Gene set enrichment analysis: A knowledge-based approach for interpreting genome-wide expression profiles". Proc. Natl. Acad. Sci. U.S.A. 102 (43): 15545–50. doi:10.1073/pnas.0506580102. PMC 1239896. PMID 16199517.
- ↑ "BioCarta - Charting Pathways of Life". Retrieved 2007-12-31.
- ↑ Vinayagam A, Hu Y, Kulkarni M, Roesel C, et al. (2013). "Protein Complex-Based Analysis Framework for High-Throughput Data Sets. 6, rs5 (2013)". Sci. Signal. 6 (r5): rs5. doi:10.1126/scisignal.2003629. PMC 3756668. PMID 23443684.
- ↑ "DBI Web". Archived from the original on 2007-07-05. Retrieved 2007-12-31.
- ↑ "SCOPE". Retrieved 2007-12-31.
- ↑ "RssGsc". Retrieved 2008-10-15.
- ↑ Chu, G., Narasimhan, B, Tibshirani, R, Tusher, V. "SAM "Significance Analysis of Microarrays" Users Guide and technical document."
- ↑ Dinu, I. P., JD; Mueller, T; Liu, Q; Adewale, AJ; Jhangri, GS; Einecke, G; Famulski, KS; Halloran, P; Yasui, Y. (2007). "Improving gene set analysis of microarray data by SAM-GS." BMC Bioinformatics 8: 242.
- ↑ Jeffery, I. H., DG; Culhane, AC. (2006). "Comparison and evaluation of methods for generating differentially expressed gene lists from microarray data." BMC Bioinformatics 7: 359.
- ↑ Tusher, V. G., R. Tibshirani, et al. (2001). "Significance analysis of microarrays applied to the ionizing radiation response." Proceedings of the National Academy of Sciences 98(9): 5116–5121.
- ↑ Wilson CL, Miller CJ (2005). "Simpleaffy: a BioConductor package for Affymetrix Quality Control and data analysis". Bioinformatics. 21 (18): 3683–5. doi:10.1093/bioinformatics/bti605. PMID 16076888.
- ↑ "J. Craig Venter Institute -- Software". Retrieved 2008-01-01.
- ↑ "Agilent | GeneSpring GX". Retrieved 2008-01-02.
- ↑ "Ocimum Biosolutions | Genowiz". Archived from the original on 2009-11-24. Retrieved 2009-04-02.
External links
- ArrayExplorer - Compare microarray side by side to find the one that best suits your research needs
- FARMS - Factor Analysis for Robust Microarray Summarization, an R package —software
- StatsArray - Online Microarray Analysis Services —software
- ArrayMining.net - web-application for online analysis of microarray data —software
- FunRich - Perform gene set enrichment analysis —software
- Comparative Transcriptomics Analysis in Reference Module in Life Sciences