Pollution in California
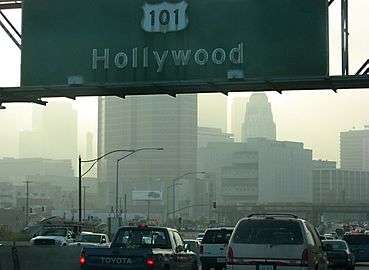
Pollution in California relates to the degree of pollution in the air, water, and land of the state of California. Pollution is defined as the addition of any substance (solid, liquid, or gas) or any form of energy (such as heat, sound, or radioactivity) to the environment at a faster rate than it can be dispersed, diluted, decomposed, recycled, or stored in some harmless form.[1] The combination of three main factors are the cause of notable unhealthy levels of air pollution in California: the activities of over 39 million people, a mountainous terrain that traps pollution, and a warm climate that helps form ozone and other pollutants.[2] Eight of the ten cities in the US with the highest year-round concentration of particulate matter between 2013 and 2015 were in California, and seven out of the ten cities in the US with the worst ozone pollution were also in California.[3] Studies show that pollutants prevalent in California are linked to several health issues, including asthma, lung cancer, birth complications, and premature death.[4] In 2016, Bakersfield, California recorded the highest level of airborne pollutants of any city in the United States.[5]
Water pollution is defined by the Federal Clean Water Act as "dredge spoil, solid waste, incinerator residue, sewage, garbage, sewage sludge, munitions, chemical wastes, biological materials, heat, wrecked or discarded equipment, rock, sand, cellar dirt, and industrial, municipal, and agricultural waste discharged into water." [6] In 2011, an Environmental Protection Agency (EPA) study showed that water quality standards were not met on 1.6 million acres of California's 3 million acres of lakes, bays, wetlands and estuaries. The Porter-Cologne Water Quality Control Act governs the water quality regulation in California.
History
The history of California's pollution dates back to 1943, when people first recognized episodes of smog causing irritated eyes, burning lungs, and nausea. Beginning in 1967, a group of California politicians and leaders teamed up to unify statewide efforts to address the severe air pollution, creating The Mulford-Carrell Air Resources Act, which formed the California Air Resources Board (CARB). That same year, the Federal Air Quality Act of 1967 was enacted, which allowed California to set more stringent air quality rules due to its unique conditions of geography, weather, and growing population.[7] Despite dramatic progress, air pollution in the United States, and California in particular, continues to harm people's health and environment. Under the Clean Air Act (United States) of 1970, the EPA works with state and local governments and federal agencies to reduce air pollution and limit the damage that is causes.[8] The Act was amended in 1977 and 1990, establishing emission standards that require the maximum degree of reduction of hazardous air pollutants.[8]
The CARB continues to work with local governments, the business sector, and the public to address California's air quality problems. In the past decade, California has become a global leader on climate change by entering agreements with several nations and linking cap-and-trade programs with Quebec.[9] Many programs have been established to reduce greenhouse gas emissions, including a Zero Emission Vehicle mandate, which is planned to clean up the transportation sector and add about 1.5 million hydrogen fuel cell vehicles to the roads by 2025.[9] The cap-and-trade program has allowed billions of dollars to be invested in reducing greenhouse gases in cities throughout California. While California has taken significant action to decrease pollution, the state remains behind the rest of the nation.[9] The ever-growing population, abundance of cars, and sunny weather continue to foster a pollution friendly environment.[9]
Air pollution

According to the American Lung Association's recent "State of the Air 2017" report, California is a leader in air pollution among other states, with the highest ozone levels.[10] The top three cities in the country with the highest recorded levels of ozone (smog) levels were Los Angeles-Long Beach, Bakersfield, and Fresno-Madera.[10] Salinas, California is only city of California that reports no days of unhealthy air quality. While the air quality in California is significantly better in northern California, more than ninety percent of Californians live in counties with unhealthy air.[10]
Los Angeles Air Pollution
Although Los Angeles remains the city with the worst ozone pollution, the state of air pollution has been improving.[11] With a population of roughly over 10 million, the Los Angeles area is a large basin with the Pacific Ocean to the west, and several mountain ranges with 11,000-foot peaks to the east and south, Los Angeles is particularly susceptible to high ozone levels.[10] Diesel engines, ports, motor vehicles, and industries are main sources of air pollution in Los Angeles. Frequent sunny days and low rainfall contribute to ozone formation, as well as high levels of fine particles and dust.[12] The strong relationship between Air Quality Index (AQI) and ozone levels may be found on air pollution maps.[13]
Air pollution in Los Angeles has caused widespread concerns. In 2011, the Public Policy Institute of California (PPIC) Survey on Californians and the Environment showed that 45% of citizens in Los Angeles consider air pollution to be a “big problem”, and 47% believe that the air quality of Los Angeles is worse than it was 10 years ago.[14] The most recent PPIC Survey of 2018 showed that the strong majority of California adults (72%) and likely voters favor the new state law mandating reductions in greenhouse gas emissions, and 56% of adults support the state's cap-and-trade program. In addition, about half of Californians believe state climate policies will lead to more jobs, while the other half expects the price of gasoline to rise.[15] In 2013, the Los Angeles-Long Beach-Riverside area ranked as the 1st most ozone-polluted city, the 4th most polluted city by annual particle pollution, and the 4th most polluted city by 24-hour particle pollution.[16]
Dangers to Health
Both ozone and particle pollution are dangerous to human health. The Environmental Protection Agency (EPA) engaged a panel of expert scientists, the Clean Air Scientific Advisory Committee, to help them assess the evidence. The EPA released their most recent review of the current research on health threat of ozone and particle pollution.[17][18]
EPA Concludes Ozone Pollution Poses Serious Health Threats:
- Causes respiratory harm (e.g. worsened asthma, worsened COPD, inflammation)
- Likely to cause early death (both short-term and long-term exposure)
- Likely to cause cardiovascular harm (e.g. heart attacks, strokes, heart disease, congestive heart failure)
- May cause harm to the central nervous system
- May cause reproductive and developmental harm
EPA Concludes Fine Particle Pollution Poses Serious Health Threats:
- Causes early death (both short-term and long-term exposure)
- Causes cardiovascular harm (e.g. heart attacks, strokes, heart disease, congestive heart failure)
- Likely to cause respiratory harm (e.g. worsened asthma, worsened COPD, inflammation)
- May cause cancer
- May cause reproductive and developmental harm
Government Intervention
Helping California meet the national air quality standards and improve the health of local residents continues to be a priority for the EPA. One of EPA's highest priorities is to support the reduction of diesel emissions from ships, trucks, locomotives, and other diesel engines.[16] In 2005, Congress authorized funding for the Diesel Emissions Reduction Act (DERA), a grant program, administrated by the EPA, to selectively retrofit or replace the older diesel engines most likely to impact human health. Since 2008, the DERA program has achieved impressive outcome of improving air quality.[19] The EPA also works with state and local partners to decrease emissions from port operations and to improve the efficient transportation of goods through the region. Together with the Port of Long Beach the EPA and the Port of Los Angeles are partners of the San Pedro Bay Ports Clean Air Action Plan, a sweeping plan aimed at significantly reducing the health risks posed by air pollution from port-related ships, trains, trucks, terminal equipment and harbor craft.[12] These two ports are the busiest container ports in the United States. For environmental justice, air pollution in low-income LA communities has received more attention. In 2011, the “Clean up Green up” campaign was launched to designate four low-income LA communities- Pacoima, Boyle Heights and Wilmington. This campaign aims to push green industries through incentives, including help obtaining permits and tax and utility rebates.[20] Although Los Angeles air pollution level has declined for the last few decades,[21] citizens in Los Angeles still suffer from high level air pollution.[22]
Air Pollution and Low Socioeconomic Status Communities in California
The U.S. Environmental Protection Agency's interactive online map - EJSCREEN - features the low socioeconomic communities across the country that are more vulnerable to air pollution and its associated health risks. As exhibited in this map, Southeast Los Angeles County neighborhoods, primarily impoverished areas in the San Joaquin Valley and Inland Empire, face a higher exposure to air pollution and environmental injustices. In such areas, those in poverty stricken areas have an unequal access to environmental health and safety resources. These poverty-stricken neighborhoods are frequently located in areas that are near freeways, hazardous facilities, and/or rail yards.[23]
Instances of Environmental Injustice
Diabetes in Los Angeles County Latino children
In 2017, researchers found that diabetes in Latino and Latina children living in Los Angeles is linked to air quality.[24] A study led by the University of Southern California was the first of its kind to follow the health and residential air pollution levels of the same children over a span of several years. The subjects of the study were overweight Latino children, between the ages of eight and fifteen, residing in areas with excess particulate matter. In particular, the neighborhoods of the children were located in areas of elevated nitrogen dioxide levels, an air pollutant caused nearby power plants and high-volume vehicle traffic.[24] The results demonstrated that the children possessed significantly increased risk factors for Type 2 diabetes by the time they turned eighteen, such as diminished efficiency in the insulin-secreting cells of the pancreas.[25] The insulin resistance that results from such a condition is a direct cause of diabetes onset.[26]
Diabetes mellitus is a disease that is characterized by the body's inability to properly regulate blood glucose (or blood sugar) levels. Prolonged levels of high blood sugar may lead to severe health complications such as heart disease, nerve damage, kidney failure, blindness, or even early death.[27] As diabetes becomes a rising epidemic, the Center for Disease Control and Prevention estimates that up to nearly 8 million U.S. citizens may have undiagnosed diabetes or its precursor.[28] Conventional medical findings suggest that unhealthy or calorie-dense diets, lack of physical activity, and family history are risk factors for developing the disease; however, recent studies are beginning to trace a connection between Type 2 diabetes and the external factor of air pollution.[25] Because socioeconomic status, race, and exposure to air pollution are frequently correlated, the CDC acknowledges certain socioeconomic conditions or races as pre-existing risk factors for Type 2 diabetes, in addition to those previously listed.[24] Statistics suggest that Hispanic people are 50% more likely to die from diabetes than whites, and studies focusing on issues of environmental injustice are able to demonstrate possible reasons for this disparity.[29]
Proximity of schools to vehicle traffic in Culver City
The spatial arrangement of Californian communities plays a large role in determining exposure to the concentrated air pollution of the state's southern regions. In one suburb of Los Angeles, El Marino Language School sits adjacent to the ten-lane Interstate 405. Students of schools like these, often elementary-aged, are subject to dramatically increased levels of pollution from automobile emissions, including carcinogenic compounds.[30] Health effects of traffic pollution include the onset of cardiovascular disease, asthma, impaired lung function, premature death, and a plethora of other complications.[31] Furthermore, the incomplete development of children's sensitive respiratory systems leads to compounded effects of air pollution when compared with the health effects of the same pollution on adults.[32]
Though the health consequences of vehicle pollution are widely recognized and some legislation has been enacted to reduce its impact, very little tangible action has actually been taken. In 2003, California passed Senate Bill No. 352, which banned the construction of new schools within 500 feet of freeways with certain exceptions.[33] However, the bill remained largely ignored as 1 in 5 schools opened between 2014 and 2015 were still in direct violation of the ban.[30] In 2015, the Environmental Protection Agency released a report titled "Best Practices for Reducing Near-Road Pollution Exposure at Schools", available both online and in-print.[32] However, without any requirements regarding school siting from the U.S. Department of Education, state-funded schools are under no obligation to follow its guidelines. The reluctance of public schools to comply with safety regulations often stems from monetary limitations that encourage the use of cheap land, a dilemma that disproportionately impacts children of poorer areas; the report noted that minority and low-income students have a higher prevalence of attendance in public schools of urban areas, such as the big cities in which busy roads and schools share territory.[30]
Fracking violations in Kern County school zones
Oil fracking is a process that involves a high pressure injection of fluid into the ground to extract oil.[34] The adverse environmental effects of this natural gas extraction are the subject of much controversy, the primary concerns of which surround the contamination of surrounding water and air sources. These risks result when underground drinking water and surface water are exposed to discharges of the chemically-infused fracking fluid due to faulty construction or operation, disposal leaks, or other unintended byproducts like the release of hazardous volatile compounds into the air.[35] In terms of air pollution, "hydrofracking" causes detriment to both the environment and human health. Enormous quantities of methane, a greenhouse gas, escape into the ozone layer of Earth's atmosphere during the extraction process, where they accelerate the impacts of climate change. Furthermore, air contaminants like nitrogen oxides, carbon monoxide, formaldehydes, and hydrogen sulfide that are released during drilling have been shown to cause harmful effects ranging from cancer, organ failure, neurological issues, to birth defects.[36]
In 2015, a study revealed that there are forty-five fracking sites within 1.5 miles of one junior high in the town of Shafter, one of California's top ten most polluted communities. The students of this community suffer from the state's decision to allow oil companies to continue hydraulic fracturing within close proximity of their schools. Parents observe severe and unexplainable health complications amongst their children, including asthma and epilepsy, that may be correlated with air toxins from the nearby wells.[37] In all of Kern County, in which Shafter is located, a staggering ten school districts sit within one mile of fracking wells. The situation becomes even more problematic when the fact that Kern County is predominantly Latino in racial/ethnic composition is considered; in fact, 20% or more of its residents are foreign-born emigrants of Asia and Latin America.[36] Some argue that the concentration of fracking sites around the community's population of color is a discriminatory practice in direct violation of California Code 11135, which states that no person shall be unlawfully subjected to discrimination by any state or state-funded agency on the basis of race or ethnic group identification.[38]
Inequalities in cumulative environmental burdens among three urbanized counties in California
In 2012, this research used the method of cumulative environmental hazard inequality Index (CEHII), which is a model developed to environmental inequality in air pollution hazards., to analyze the environmental inequality in three counties in California: Alameda, San Diego and Los Angeles (Jason et al. 2012). In addition to frequently used air pollution parameter like NO2, PM 2.5 and diesel PM, a metric of heat stress was included for the analysis because excessive heat weather comes to be an environmental problem that can threaten human health.
The result indicated that colored communities bear greater air pollution including NO2, PM 2.5, PM 10, and heat stress compared to predominantly white and more affluent communities. In San Diego County, the relative heat stress inequality was founded to be the highest. Also, significant heat stress inequality was observed in Los Angeles. The result shows that in these two counties, there was a strong positive correlation between the percentage of Non-Whites in the community and heat stress inequality. However, in Alameda county, an opposite pattern was found: he community with a higher White population experienced more extreme temperature exceedances. This might be explained by the fact that the White population and the more affluent class in Alameda County mainly lived in the eastern area further away from the coast, which resulted in the higher heat stress exposure.
Also, the research verified that poverty status is consistent with the trend of disproportion burden of the racial-ethnic status. As the analysis was conducted according to the poverty status instead of racial-ethnic status for air pollutants NO2, PM2.5, and diesel PM, the results indicated the similar result as the analysis to heat stress. Furthermore, from the data, a strong correlation was found between poverty and proportion of non-white population (Alameda: r=0.69, Los Angeles: r=0.77). Above all, this research demonstrates that air pollution is disproportionally distributed according to the socioeconomic and racial-ethnic status in the United States.
As a future direction of study, it plans to classify the inequality that exists in African American, Hispanic, Asian, and other ethnic groups. Furthermore, the technique used in this research provided a way to assess environmental inequality and the results can be used to assist decision makers in efforts to address environmental inequality issues.[39]
Proposed coal terminal in West Oakland
In February 2016, the city of Oakland publicly announced construction plans for the Oakland Bulk and Oversized Terminal, a bulk exporting facility in West Oakland. As a predominantly Latino and African-American community, the residents of West Oakland live in a community that suffers from dangerous levels of air pollution. The construction of this port and its proposed partnership with Utah's coal-mining counties would rank the city as the lead coal exporter on the West Coast.[40] To fund such a goliath project in the face of strong resistance from city councils fighting to protect their local communities from drastically increasing pollution emissions, Utah state and county officials arranged a controversial $53 million loan.[41] The fund, composed of taxpayer dollars intended for local projects, would allow for the annual shipping of 9 million tons of coal through Oakland and an increase in national coal exports by 19%.[42] A movement by environmental advocates quickly grew, citing that exposure to toxic coal dust would also subject the city's residents to increased risks of bronchitis, pneumonia, heart disease, emphysema, and more.[40]
In response, thousands of Oakland residents and environmental rights activists worked together to prevent the construction of the coal terminal at the former Oakland Army Base. In July 2016, Oakland City Council voted to ban coal from being handled and stored in the City of Oakland.[40] The decision marked a large victory for the newly established Department of Race and Equity,[43] an organization designed to protect Oakland's predominanty African-American community from social and racial disparities.[44] According to the "Toxic Wastes and Race in the United States" report issued by the East Bay Community Foundation, those living in West Oakland already encounter five times more toxic pollution per person than residents of the city of Oakland, and children living in West Oakland are seven times more likely to be hospitalized for asthma than the average child in California.[40] The residents of West Oakland are more likely to face both decreased life expectancy and asthma-related emergency room visits.[44] For a city already bearing a disproportionate amount of environmental burdens, the fight for a coal-free Oakland was a success for proponents of environmental justice.
Causes
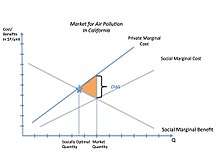
Air pollution stems from a number of sources, and the amount of pollutant from each source differs from place to place. Particulate pollution sources are shown in the graph at right. Residential wood combustion, such as burning wood in fireplaces, is the largest source of PM 2.5 pollution.
The Clean Air Act requires the US EPA to regulate six common pollutants. These air pollutants (also known as "criteria pollutants") are found all over the United States. They are particle pollution, ground-level ozone, carbon monoxide, sulfur oxides, nitrogen oxides, and lead. All of these pollutants have been shown to have adverse health and environmental impacts and some can cause property damage. Of the six pollutants, particle pollution and ground-level ozone are the most widespread health threats. EPA calls these pollutants "criteria" air pollutants because it regulates them by developing human health-based and/or environmentally based criteria (science-based guidelines) for setting permissible levels.
Fossil fuels are a leading source of air and water pollution in the United States. The Clean Air Act estimated the economic cost of air pollution to be $9 trillion between 1970 and 2000. These costs involve pollution-induced health effects and lost productivity. Additionally, global warming is predicted to inflict a variety of other costs, and with declining rainfalls and rising temperatures, global warming can increase the formation of ozone smog and worsen pollution.[45]
Land pollution is principally caused by thoughtless or illegal disposal of waste waters or solids containing pollutants. Dumping garbage, and littering on the ground, although unsightly, rarely cause much lasting damage unless the material contains non degradable materials such as many plastics or is at risk of entering a watercourse and thus eventually reaching the sea.
Effects
Studies have proven there are several negative health outcomes associated with breathing polluted air.[46] Studies have found that some pollutants have damaging effects on humans, especially during pregnancy. More specifically, results from several epidemiological studies suggest that exposure of pregnant women to air pollution results in higher risks of low birth weight in term born infants.[47] Studies done on humans exposed to pollutants, one of them being polychlorinated biphenyls, which causes decreased birth size, increased sexual development, and altered levels of hormones related to gland regulation.[48] Long-term exposure to particulate air pollution is associated with mortality from heart disease and stroke.[46] Affected populations can develop a higher risk for lung cancer by breathing polluted air. Many studies examine the effect of children's health. Some of the findings show that children's lung function growth is adversely affected by air pollution, high levels of air pollution is associated with increased amount of asthma cases or asthma exacerbations in children, and school absences from acute respiratory illnesses resulted following rises in ozone levels in student communities.[46] Additionally, numerous problems have been found by the CA Department of Health Services in classrooms at several hundred schools throughout California such as inadequate ventilation, poor thermal comfort, high formaldehyde levels, and toxic residues in floor dust.[46]
There are also economic repercussions from the effects of pollution in California. One study suggests the health-related impacts of air pollution in San Joaquin Valley drains the regions economy of $3 billion every year.[49] The study calculates the cost of pollution in Central Valley averages $1,000 per person per year, representing the costs of premature deaths, asthma attacks, acute bronchitis in children, school absences, lost work days, etc.[49]
Water Pollution
Water quality regulations started in the 1960's and 1970's with the passage of the California’s Porter-Cologne Water Quality Control Act and the federal Clean Water and Safe Drinking Water Acts, which prevent discharges of pollution into water bodies and control the quality of water that comes out of the tap.[50] Pollution in water systems occurs when toxic substances enter water systems such as lakes, rivers, and oceans and cause degradation.
Ocean Litter
The issue of ocean pollution does not only affect California’s Pacific coast, it is an international issue. According to the National Oceanic and Atmospheric Administration marine debris, there is no place on Earth that has been left untouched by the debris. [51]Marine debris is anything man-made that ends up in marine environments. Some of the most common items that end up as debris are plastics, abandoned vessels, and fishing gear. Of the marine debris, approximately 80% originates from land, the other percentage comes from sea disposal. [52] The North Pacific Subtropical Gyre (NPSG) commonly referred to as the ‘Great Pacific Garbage Patch’ is a result of the marine debris accumulating. [53]
While access to plastic has increased the amount of plastic in marine environments reciprocates. These plastic products in marine environments degrade slowly, remaining floating for an extended amount of time or sink to the bottom where they can remain for up to several decades. The threats posed by the plastic in the ocean and other bodies if water includes animals becoming entangled leading to drowning, ingestion which can lead to digestive and feeding issues.[54] The issue of ocean pollution affects marine wildlife, human health and California’s tourist economy. The litter other than becoming an eyesore to California’s beaches can also negatively affect coastal communities economy. [55]
See also
- Central Valley groundwater pollution
- Climate change in California
- Environmental impact of shipping
- Pollution in Long Beach, California
Government response:
References
- ↑ "Pollution - Definition from the Encyclopedia Britannica". britannica.com. 2018-02-28. Retrieved 2018-03-05.
- ↑ Air Pollution in California? (n.d.). Retrieved March 5, 2018, from https://www.arb.ca.gov/knowzone/students/airpollu/airpolpage/whyis.htm
- ↑ Schlanger, Zoe. "California is home to eight of the 10 cities in America where air pollution is worst." Quartz Media 19 Apr. 2017
- ↑ Genc, Sermin et al. “The Adverse Effects of Air Pollution on the Nervous System.” Journal of Toxicology 2012 (2012): 782462. PMC. Web. 6 Mar. 2018.
- ↑ Associated Press. "Los Angeles and Bakersfield top list of worst air pollution in the nation" Los Angeles Times 20 Apr. 2016
- ↑ Water, article by Arnold S. Vernick, in Mark’s Standard Handbook for Mechanical Engineers, 11th Edition, McGraw Hill, New York, 2007.
- ↑ California Air Resources Board. Retrieved 05 March 2018 from https://ww2.arb.ca.gov/about/history
- 1 2 EPA,OA,OP,ORPM,RMD, US. "Summary of the Clean Air Act | US EPA". US EPA. Retrieved 2018-03-07.
- 1 2 3 4 "History | California Air Resources Board". ww2.arb.ca.gov. Retrieved 2018-03-07.
- 1 2 3 4 "California named state with the worst air quality (again)". ScienceDaily. Retrieved 2018-03-07.
- ↑ Press, Associated. "Los Angeles and Bakersfield top list of worst air pollution in the nation". latimes.com. Retrieved 2018-03-07.
- 1 2 "Air Quality: Pacific Southwest, Region 9: Southern California". US EPA. February 22, 2016. Retrieved October 21, 2017.
- ↑ "Los Angeles: Maps of air pollution level (AQI, ozone, particle matter)". aerostate.io. Retrieved 15 February 2018.
- ↑ Mark Baldassare, Dean Bonner, Sonja Petek, Jui Shrestha (July 2011). "PPIC Statewide Survey: Californians and the environment" (PDF). Public Policy Institute of California & The William and Flora Hewlett Foundation. Retrieved October 19, 2017.
- ↑ Baldassare, M., Bonner, D., Lopes, L., Kordus, D., "PPIC Statewide Survey: Californians and the Environment." (July, 2017). retrieved from http://www.ppic.org/publication/ppic-statewide-survey-californians-and-the-environment-july-2017/
- 1 2 "Most Polluted Cities". American Lung Association. 2013. Retrieved October 19, 2017.
- ↑ American Lung Association, Ozone Pollution, 2013. http://www.stateoftheair.org/2013/health-risks/health-risks-ozone.html#_edn23
- ↑ American Lung Association, Particle Pollution, 2013. http://www.stateoftheair.org/2013/health-risks/health-risks-particle.html#ref64
- ↑ U.S. EPA., 2012. http://epa.gov/cleandiesel/documents/420r12031.pdf
- ↑ L. A. Times, Jan 21, 2012 http://articles.latimes.com/2011/jan/21/local/la-me-hazards-pacoima-20110121
- ↑ Pollack, Ilana; Ryerson, Thomas (13 June 2013). "Trends in ozone, its precursors, and related secondary oxidation products in Los Angeles, California: A synthesis of measurements from 1960 to 2010". Journal of Geophysical Research: Atmospheres. 118 (11): 5893–5911. doi:10.1002/jgrd.50472.
- ↑ Marziali, Carl (4 March 2015). "L.A.'s Environmental Success Story: Cleaner Air, Healthier Kids". USC News. Retrieved 16 March 2015.
- ↑ EPA,OECA,IO,OEJ, US. "EJSCREEN: Environmental Justice Screening and Mapping Tool". www.epa.gov. Retrieved 2017-04-04.
- 1 2 3 "Diabetes in Latino children linked to air pollution ‒ study". RT International. Retrieved 2017-04-04.
- 1 2 "Air pollution linked to heightened risk of type 2 diabetes in obese Latino children". EurekAlert!. Retrieved 2017-04-04.
- ↑ Meo, S. A.; Memon, A. N.; Sheikh, S. A.; Rouq, F. A.; Usmani, A. Mahmood; Hassan, A.; Arian, S. A. (2015-01-01). "Effect of environmental air pollution on type 2 diabetes mellitus". European Review for Medical and Pharmacological Sciences. 19 (1): 123–128. ISSN 2284-0729. PMID 25635985.
- ↑ "What is Diabetes? | NIDDK". National Institute of Diabetes and Digestive and Kidney Diseases. Retrieved 2017-04-24.
- ↑ "Diabetes | At A Glance Reports | Publications | Chronic Disease Prevention and Health Promotion | CDC". www.cdc.gov. Retrieved 2017-04-24.
- ↑ "Hispanic Diabetes Prevention". Centers for Disease Control and Prevention. Retrieved 2017-04-24.
- 1 2 3 "The invisible hazard afflicting thousands of schools". Center for Public Integrity. 2017-02-17. Retrieved 2017-04-04.
- ↑ "Living Near Highways and Air Pollution". American Lung Association. Retrieved 2017-04-24.
- 1 2 EPA,OA,OEAEE,OWC, US. "Best Practices for Reducing Near-Road Air Pollution Exposure at Schools". www.epa.gov. Retrieved 2017-04-24.
- ↑ "Bill Text - SB-352 Schoolsites: sources of pollution". leginfo.legislature.ca.gov. Retrieved 2017-04-24.
- ↑ "An overview of hydraulic fracturing and other formation stimulation technologies for shale gas production - Update 2015 - European Commission". ec.europa.eu. Retrieved 2017-04-14.
- ↑ EPA,OA,OEAEE,OWC, US. "Natural Gas Extraction - Hydraulic Fracturing". www.epa.gov. Retrieved 2017-04-04.
- 1 2 Funes, Yessenia (2016-09-08). "For Some California Kids, Back-to-School Means Back To The Dangers of Fracking Wells". Colorlines. Retrieved 2017-04-24.
- ↑ "There are 45 fracked wells within 2 miles of my daughter's school". The Guardian. 2015-08-20. ISSN 0261-3077. Retrieved 2017-04-04.
- ↑ "2005 California Government Code Sections 11135-11139.8 :: :: :: Article 9.5. :: Discrimination". Justia Law. Retrieved 2017-04-24.
- ↑ Jason G. Su, Michael Jerrett, Rachel Morello-Frosch, Bill M. Jesdale, Amy D. Kyle (2012). ""Inequalities in cumulative environmental burdens among three urbanized counties in California"". Environment International: 79–87.
- 1 2 3 4 King, Brittany. "Fight for a Coal-free Oakland". Sierra Club. Retrieved April 11, 2017.
- ↑ Yardley, William (2015-12-11). "How Utah quietly made plans to ship coal through California". Los Angeles Times. ISSN 0458-3035. Retrieved 2017-04-24.
- ↑ Ayers, Christin. "Proposed Oakland Coal Depot Racing Against The Clock". Retrieved 2017-04-24.
- ↑ "Department of Race and Equity". City of Oakland, California. Retrieved 2017-10-25.
- 1 2 "Guest commentary: Saying no to coal in Oakland is the right thing to do". East Bay Times. Retrieved 2017-04-24.
- ↑ "The High Cost of Fossil Fuels". environmentcalifornia.org. Retrieved 2018-03-07.
- 1 2 3 4 "Research on Health Effects of Air Pollution | California Air Resources Board". ww2.arb.ca.gov. Retrieved 2018-03-07.
- ↑ Laurent O., Hu J., Li L., Kleeman M., Bartell S., Cockburn M., Escobedo L., Wu J. (May 2016). "Low birth weight and air pollution in California: Which sources and components drive the risk?". Environmental International – via EconLit.
- ↑ Schell, L. "Effects of pollution on human growth and development: an introduction". J Physiol Anthropol. 25: 103–12. doi:10.2114/jpa2.25.103. PMID 16617215.
- 1 2 "New Study Finds Central Valley Air Pollution Costs Regional Economy $3 Billion Annually". Hewlett Foundation. Retrieved 2018-03-07.
- ↑ "Californias Water Quality".
- ↑ "Types and Sources". Marine Debris Program Office of Response and Restoration. National Oceanic and Atmospheric Administration.
- ↑ "Toxicological Threats of Plastic". United States Environmental Protection Agency.
- ↑ Goldstein, Miriam Chanita. "Abundance and ecological implications of microplastic debris in the North Pacific Subtropical Gyre". ProQuest Dissertation Publishing. ProQuest.
- ↑ Laist, David W. (1987). "Overview of the Biological Effects of Lost and Discarded Plastic Debris in the Marine Environment". Marine Pollution Bulletin. 18 (6B): 312-326.
- ↑ "Impacts". Marine Debris Program Office of Response and Restoration. National Oceanic and Atmospheric Administration.
External links
- BurningIssues/Clean Air Revival An educational California site on air pollution
- Breathe California