List of barangays in Zamboanga City

Location map of barangays of Zamboanga City

A barangay, also known by its former Spanish adopted name, the barrio, is the smallest administrative division in the Philippines and is the native Filipino term for a village, district or ward. Barangays are further subdivided into smaller areas called Puroks (English: Zone).[1]

The former lone Legislative district of Zamboanga City is the representation of the City of Zamboanga in the Philippine House of Representatives. Zamboanga City was part of the representation of the Zamboanga Province from 1935 to 1953, of Zamboanga del Sur from 1953 to 1972 and of Region IX from 1978 to 1984. It was granted its own representation in 1984 by the Batasang Pambansa.

The legislative district of Zamboanga City was divided into two districts from 2007 elections in accordance with article VI, section V, part (3) of the Constitution and Republic Act No. 9269 as approved by the 12th Congress of the Philippines and signed into law by President Gloria Macapagal-Arroyo on March 19, 2004.

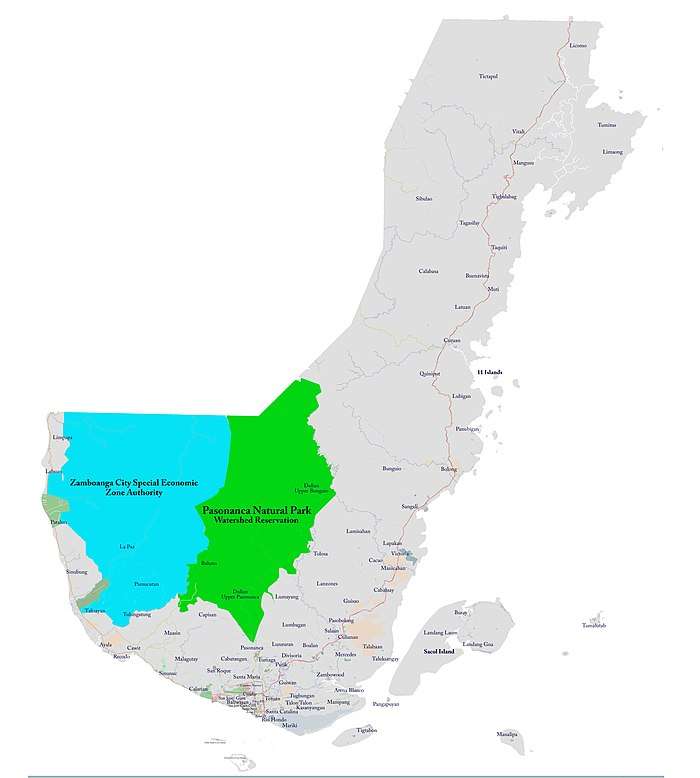
On November 22, 1983, Zamboanga City was declared as a Highly Urbanized City under the provisions of the Local Government Code. Covering approximately 148,338.49 hectares, Zamboanga City is composed of 98 barangays (31 of which are island barangays) spanning over 87 kilometers 5 towards the northeast to the Province of Zamboanga del Sur and 40 kilometers towards the northwest to the Province of Zamboanga del Norte.

District I (West Coast)

  • Baliwasan
  • Ayala
  • Sta. Maria
  • Baluno
  • Cabatangan
  • Calarian
  • Camino Nuevo
  • Campo Islam
  • Canelar
  • Capisan
  • Cawit
  • Dulian Pasonanca
  • Kasanyangan
  • La Paz
  • Labuan
  • Lamisahan
  • Limpapa
  • Maasin
  • Malagutay
  • Pamucutan
  • Pasonanca
  • Patalon
  • Recodo
  • Lower Calarian
  • Suterville
  • Rio Hondo
  • San Jose Cawa Cawa
  • San Jose Gusu
  • San Ramon
  • San Roque
  • Sinunuc
  • Sinubong
  • Sta. Barbara
  • Sta. Cruz (Island Barangay)
  • Sta. Maria
  • Sto. Niño
  • Talisayan
  • Tulungatung
  • Tumaga
  • Luyahan
  • Zone I
  • Zone II
  • Zone III
  • Zone IV

District II (East Coast)

  • Arena Blanco
  • Boalan
  • Bolong
  • Buenavista
  • Bunguiao
  • Busay (Island Barangay)
  • Cabaluay
  • Cacao
  • Calabasa
  • Culianan
  • Curuan
  • Dita
  • Divisoria
  • Dulian Bunguiao
  • Guisao
  • Guiwan
  • Landang Gua (Island Barangay)
  • Landang Laum (Island Barangay)
  • Lanzones
  • Lapakan
  • Latuan Curuan
  • Licomo
  • Limaong
  • Lubigan
  • Lumayang
  • Lumbangan
  • Lunzuran
  • Mampang
  • Manalipa
  • Manicahan
  • Mangusu
  • Mariki
  • Mercedes
  • Muti
  • Pangapuyan (Island Barangay)
  • Panubigan
  • Pasilmanta (Island Barangay)
  • Pasabolong
  • Putik
  • Quiniput
  • Salaan
  • Sangali
  • Sibulao Curuan
  • Sta. Catalina
  • Tagasilay
  • Taguiti
  • Talabaan
  • Talon-Talon
  • Taluksangay
  • Tetuan
  • Tictapul
  • Tigbalabag
  • Tigtabon (Island Barangay)
  • Tolosa
  • Tugbungan
  • Tumalutab (Island Barangay)
  • Tumitus
  • Victoria
  • Vitali
  • Zambowood

Population

Zamboanga City (98) ninety eight barangays Overview
Administration Population Code and Class
DistrictOfficial nameArea(ha)[2]Official 2015Official 2010ChangeCode Urban/Rural
IIArena Blanco 51.571712,589 10,016 +25.69%97332001Rural
IAyala 529.130322,547 20,096 +12.20%97332002Rural
IBaliwasan 126.547625,042 27,070 −7.49%97332004Urban
IBaluno 1,643.46023,155 2,315 +36.29%97332005Rural
IZone I 14.79664,112 3,405 +20.76%97332061Rural
IZone II 12.93382,143 2,865 −25.20%97332062Rural
IZone III 29.02951,519 2,030 −25.17%97332063Rural
IZone IV 27.10361,309 3,046 −57.03%97332064Urban
IIBoalan 865.5618,696 7,435 +16.96%97332010Urban
IIBolong 1,574.05946,460 5,862 +10.20%97332011Rural
IIBuenavista 1,003.51896,485 5,837 +11.10%97332012Rural
IIBunguiao 2,562.07277,287 7,368 −1.10%97332013Rural
IIBusay (Sacol Island) 436.36633,359 2,931 +14.60%97332014Rural
IICabaluay 872.29866,350 5,802 +9.45%97332015Rural
ICabatangan 896.649413,680 9,944 +37.57%97332016Rural
IICacao 1,194.45811,347 1,045 +28.90%97332017Rural
IICalabasa 1,849.93533,222 2,685 +20.00%97332018Rural
ICalarian 253.888728,899 25,331 +14.09%97332019Urban
ICamino Nuevo 68.68037,739 8,295 −6.70%97332099Urban
ICampo Islam 26.260612,552 11,237 +11.70%97332020Urban
ICanelar 92.718511,100 11,160 −0.54%97332021Urban
ICapisan 490.56771,408 1,090 +29.17%97332098Rural
ICawit 378.07629,249 9,124 +1.37%97332022Rural
IICulianan 900.53288,318 8,524 −2.42%97332023Urban
IICuruan 7,216.06958,796 7,378 +19.22%97332024Urban
IIDita 133.72222,085 3,831 −45.58%97332025Rural
IIDivisoria 286.27079,218 9,042 +1.95%97332026Rural
IIDulian (Upper Bunguiao) 1,542.32992,570 2,023 +27.04%97332027Rural
IDulian (Upper Pasonanca)679.63961,325 1,363 −2.79%97332028Rural
IIGuisao 567.33873,398 2,560 +32.73%97332030Rural
IIGuiwan 178.020514,302 15,323 −6.66%97332031Rural
IIKasanyangan14,114 8,425 +67.53%97332101Rural
ILa Paz 1,740.08227,557 5,606 +34.80%97332032Urban
ILabuan 1,961.720311,457 11,470 −0.11%97332033Urban
IILamisahan2,125.88882,289 2,995 −23.57%97332034Rural
IILandang Gua 589.85592,993 2,980 +0.44%97332035Rural
IILandang Laum 268.5474,768 4,803 −0.73%97332036Rural
IILanzones 953.14013,287 2,743 +19.83%97332037Rural
IILapakan 955.3831,378 1,529 −9.88%97332038Rural
IILatuan (Curuan) 98.07662,457 2,125 +15.62%97332039Rural
IILicomo 1,707.89955,317 5,727 −7.16%97332100Rural
IILimaong1,853.78324,000 3,445 +16.11%97332040Rural
ILimpapa 696.30895,782 5,160 +12.05%97332041Rural
IILubigan 1,416.70212,945 1,149 +156.31%97332042Rural
IILumayang 790.05151,471 1,377 +6.83%97332043Rural
IILumbangan 440.16253,235 3,308 −2.21%97332044Rural
IILunzuran 742.52469,931 8,221 +20.80%97332045Rural
IMaasin 556.4268,958 7,978 +12.28%97332046Rural
IMalagutay 627.88046,657 5,654 +17.74%97332047Rural
IIMampang 726.093734,312 22,857 +50.12%97332048Rural
IIManalipa 288.44442,143 1,922 +11.50%97332049Rural
IIMangusu 828.19454,783 4,776 +0.15%97332050Rural
IIManicahan 1,801.746510,081 9,129 +10.43%97332051Urban
IMariki 0.30851,775 5,895 −69.89%97332052Rural
IIMercedes 1,288.563414,721 12,050 +22.17%97332053Urban
IIMuti 1,233.22682,983 3,123 −4.48%97332054Rural
IPamucutan 563.14174,059 3,764 +7.84%97332055Urban
IIPangapuyan 9.2339590 534 +10.49%97332056Rural
IIPanubigan 431.00321,610 982 +63.95%97332057Rural
IIPasilmanta (Sacol Island) 664.14812,122 1,480 +43.38%97332058Rural
IIPasobolong3,758 3,257 +15.38%97332102Rural
IPasonanca 1,146.66527,374 27,231 +0.53%97332059Urban
IPatalon 1,400.88938,128 7,187 +13.09%97332060Rural
IIPutik 279.21519,681 19,653 +0.14%97332065Rural
IIQuiniput 1,031.67623,329 2,647 +25.77%97332066Rural
IRecodo 176.676417,395 18,172 −4.28%97332067Urban
IRio Hondo 180.3723,326 10,565 −68.52%97332068Urban
IISalaan 1,698.9464,073 3,310 +23.05%97332069Rural
ISan Jose Cawa-cawa 36.23096,173 7,991 −22.75%97332070Urban
ISan Jose Gusu 154.617816,723 24,542 −31.86%97332071Urban
ISan Roque 406.646327,889 25,531 +9.24%97332072Urban
IISangali 1,259.321220,766 19,230 +7.99%97332073Urban
ISanta Barbara 14.79664,762 7,961 −40.18%97332074Rural
IISanta Catalina 54.208317,294 17,955 −3.68%97332075Rural
ISanta Maria 355.814625,185 21,926 +14.86%97332076Urban
ISanto Niño 25.08314,129 6,790 −39.19%97332077Rural
IISibulao (Caruan) 1,148.75884,244 2,748 +54.44%97332078Rural
ISinubung 905.13684,689 2,690 +74.31%97332079Rural
ISinunuc 852.839716,507 16,942 −2.57%97332080Urban
IITagasilay 1,616.59752,971 2,607 +13.96%97332081Rural
IITaguiti 1,377.3381,460 899 +62.40%97332082Rural
IITalabaan 891.8545,340 4,181 +27.72%97332083Urban
ITalisayan3,498.23878,220 7,285 +12.83%97332084Urban
IITalon-talon 591.837934,916 30,535 +14.35%97332085Urban
IITaluksangay 25.070710,237 8,108 +26.26%97332086Rural
IITetuan 304.230429,785 29,082 +2.42%97332087Urban
IITictapul 202.77183,817 3,515 +8.59%97332088Rural
IITigbalabag 1,357.97651,803 1,491 +20.93%97332089Rural
IITigtabon 22.17145,292 5,071 +4.36%97332090Rural
IITolosa 551.34982,773 3,157 −12.16%97332091Rural
IITugbungan 380.709823,837 23,001 +3.63%97332092Rural
ITulungatung 278.07439,246 6,055 +52.70%97332093Rural
ITumaga 273.997930,824 25,184 +22.40%97332094Urban
IITumalutab 76.3932,417 2,048 +18.02%97332095Rural
IITumitus 1,786.53,026 2,494 +21.33%97332096Rural
IIVictoria2,802 2,326 +20.46%97332103Rural
IIVitali 5,409.20999,406 8,895 +5.74%97332097Urban
IIZambowood10,166 7,627 +33.29%97332104Rural
NA25/33 other Islands [3] [4]6,248.5NA NA NANANA
Zamboanga City861,799 807,129
Source: Philippine Statistics Authority 2015 Census August 1, 2015

References

  1. http://www.zamboanga.com/barangay/barangay_body.html
  2. "Zamboanga City Barangays with Land Area". Zamboanga City Official Website. Retrieved 28 November 2016.
  3. "Location and Physical Profile". City Government of Zamboanga. Archived from the original on 12 May 2016. Retrieved 28 November 2016.
  4. "Action Plan Report Zamboanga City". Philippine Sanitation Alliance (USAID) Website. Retrieved 29 November 2016.
This article is issued from Wikipedia. The text is licensed under Creative Commons - Attribution - Sharealike. Additional terms may apply for the media files.