List of Brisbane Broncos records
The Brisbane Broncos rugby league football club has maintained team and individual player records since they entered the Winfield Cup premiership in 1988.
Game records
Biggest wins
| Margin | Score | Opponent | Venue | Date |
|---|---|---|---|---|
| 65 | 71–6 | Newcastle Knights | Suncorp Stadium | 27 May, 2007[1] (Round 11) |
| 54 | 60–6 | North Sydney Bears | ANZ Stadium | 26 April, 1998 (Round 7) |
| 54 | 0–54 | Gold Coast Titans | Robina Stadium | 5 August, 2017 (Round 22) |
| 54 | 58–4 | North Queensland Cowboys | Stadium Australia | 12 April 1998 (Round 5) |
| 53 | 53-0 | Newcastle Knights | Suncorp Stadium | 16 April, 2016[2] (Round 7) |
| 52 | 56–4 | Western Suburbs Magpies | ANZ Stadium | 21 June 1998 (Round 15) |
| 50 | 50–0 | Balmain Tigers | ANZ Stadium | 13 August, 1993 (Round 20) |
| 50 | 54–4 | Illawarra Steelers | ANZ Stadium | 6 April, 1996 (Round 3) |
| 50 | 56–6 | South Sydney Rabbitohs | ANZ Stadium | 13 August, 1995 (Round 20) |
Biggest losses
| Margin | Score | Opponent | Venue | Date |
|---|---|---|---|---|
| 56 | 0–56 | Canberra Raiders | Canberra Stadium | 1 August, 2009 (Round 21) |
| 46 | 22–68 | Parramatta Eels | Parramatta Stadium | 2 September, 2007 (Round 25) |
| 46 | 4–50 | Melbourne Storm | Olympic Park | 2 April, 2005 (Round 4) |
| 44 | 4–48 | Melbourne Storm | Olympic Park | 5 June, 2009 (Round 13) |
| 44 | 0–44 | Newcastle Knights | EnergyAustralia Stadium | 6 July, 2001 (Round 18) |
| 42 | 6–48 | Melbourne Storm | Suncorp Stadium | 1 July, 2016 (Round 17) |
| 42 | 6–48 | Melbourne Storm | ANZ Stadium | 21 March, 1999 (Round 3) |
| 40 | 0–40 | Melbourne Storm | Olympic Park | 9 September, 2007 (Qualifying Final) |
Attendances
Home
| Stadium | Crowd | Opponent | Round |
|---|---|---|---|
| Suncorp Stadium | 52,347 | Manly-Warringah Sea Eagles | Round 10, 2016 NRL season |
| ANZ Stadium | 58,912 | Cronulla-Sutherland Sharks | 1997 Super League Grand Final, |
Other
| Stadium | Crowd | Opponent | Round |
|---|---|---|---|
| ANZ Stadium | 54,220 | Wigan | 1994 World Club Challenge |
| Stadium Australia | 82,758 | North Queensland Cowboys | 2015 NRL Grand Final |
Individual records
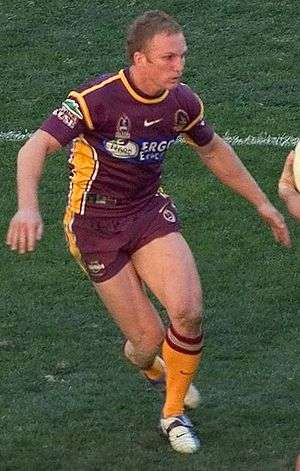
Darren Lockyer playing for the Broncos in 2004. Lockyer made his Broncos debut in 1995 and is a former captain of the team. He holds the record for most games played for the Broncos (341) and most points for the Broncos (1,143).
Most games (200+)
| Games | Player | Period |
|---|---|---|
| 355 | Darren Lockyer | 1995–2011 |
| 347 | Corey Parker | 2001–2016 |
| 304 | Sam Thaiday | 2003-2018 |
| 274 | Michael Hancock | 1988–2000 |
| 258 | Allan Langer | 1988–1999, 2002 |
| 255 | Andrew Gee | 1989–1999, 2002–2003 |
| 254 | Shane Webcke | 1995–2006 |
| 241 | Kevin Walters | 1990–2001 |
| 238 | Alex Glenn | 2009-current |
| 236 | Andrew McCullough | 2009-current |
| 235 | Petero Civoniceva | 1998–2007, 2012 |
| 218 | Tonie Carroll | 1996–2000, 2003–2009 |
| 200 | Brad Thorn | 1994–2000, 2005–2007 |
Most career points (400+)
| Points | Player | Tries | Goals | Field Goals |
|---|---|---|---|---|
| 1,222 | Corey Parker | 36 | 539 | 0 |
| 1,191 | Darren Lockyer | 122 | 341/500 | 21 |
| 1,062 | Michael De Vere | 64 | 403/526 | 0 |
| 744 | Terry Matterson | 29 | 314/488 | 0 |
| 568 | Steve Renouf | 142 | 0 | 0 |
| 484 | Michael Hancock | 120 | 2/6 | 0 |
| 480 | Julian O'Neill | 33 | 169/247 | 10 |
| 461 | Jordan Kahu | 42 | 145 | 3 |
| 442 | Wendell Sailor | 110 | 1/1 | 0 |
| 421 | Allan Langer | 100 | 8/14 | 5 |
| 414 | Willie Carne | 72 | 63/103 | 0 |
Most career tries
| Games | Player | Period |
|---|---|---|
| 142 | Steve Renouf | 1988–1999 |
| 122 | Darren Lockyer | 1995-2011 |
| 120 | Michael Hancock | 1988–2000 |
| 110 | Wendell Sailor | 1993-2001 |
| 100 | Allan Langer | 1988–1999, 2002 |
| 78 | Corey Oates | 2013-current |
| 77 | Shaun Berrigan | 1999-2007 |
Most tries in a match
| Tries | Player | Match details |
|---|---|---|
| 4 | Steve Renouf | vs. North Sydney Bears, Lang Park, Round 20,1991 (Brisbane won 44–6) |
| 4 | Steve Renouf | vs. Canterbury Bulldogs, ANZ Stadium, Round 17, 1993 (Brisbane won 38–18) |
| 4 | Steve Renouf | vs. Balmain Tigers, Optus Oval, Round 7, 1994 (Brisbane won 36–14) |
| 4 | Steve Renouf | vs. Auckland Warriors, ANZ Stadium, Round 22, 1995 (Brisbane won 44–6) |
| 4 | Steve Renouf | vs. Penrith Panthers, ANZ Stadium, Round 3, 1998 (Brisbane won 26–18) |
| 4 | Wendell Sailor | vs. St George Illawarra Dragons, Aussie Stadium, Semi-final, 2001 (Brisbane won 44–28) |
| 4 | Karmichael Hunt | vs. South Sydney Rabbitohs, Suncorp Stadium, Round 17, 2004 (Brisbane won 48–28) |
| 4 | Justin Hodges | vs. Penrith Panthers, Suncorp Stadium, Round 3, 2007 (Brisbane lost 29–28) |
| 4 | Denan Kemp | vs. Parramatta Eels, Suncorp Stadium, Round 12, 2008 (Brisbane won 30–26) |
| 4 | Israel Folau | vs. Gold Coast Titans, Suncorp Stadium, Round 10, 2009 (Brisbane won 32–18) |
| 4 | Corey Oates | vs. Manly Sea Eagles, Suncorp Stadium, Round 25, 2018 (Brisbane won 48–16) |
Most goals in a match
| Goals | Kicker | Match details |
|---|---|---|
| 10 | Corey Parker | vs. Penrith Panthers, Suncorp Stadium, Round 1, 2008 (Brisbane won 48–12) |
| 9 | Darren Lockyer | vs. North Queensland Cowboys, ANZ Stadium, Round 5, 1998 (Brisbane won 58–4) |
| 9 | Michael De Vere | vs. North Queensland Cowboys, ANZ Stadium, Round 14, 2001 (Brisbane won 50–6) |
| 9 | Darren Lockyer | vs. Parramatta Eels, Suncorp Stadium, Round 5, 2005 (Brisbane won 54–14) |
| 9 | Corey Parker | vs. Penrith Panthers, Suncorp Stadium, Round 23, 2009 (Brisbane won 58–24) |
Most points in a match
| Points | Scorer | Match details |
|---|---|---|
| 26 (3 tries, 7 goals) | Lote Tuqiri | vs. Northern Eagles, ANZ Stadium. 11 May 2002 (Brisbane won 50–12) |
| 24 (2 tries, 8 goals) | Terry Matterson | vs. Manly-Warringah Sea Eagles, Lang Park. 6 March 1988 (Brisbane won 44–10) |
| 24 (2 tries, 8 goals) | Michael De Vere | vs. Penrith Panthers, ANZ Stadium. 2 July 2000 (Brisbane won 48–6) |
| 24 (2 tries, 8 goals) | Michael De Vere | vs. St George Illawarra Dragons, WIN Stadium. 16 July 2000 (Brisbane won 44–14) |
| 24 (1 try, 10 goals) | Corey Parker | vs. Penrith Panthers, Suncorp Stadium. 16 March 2008 (Brisbane won 48–12) |
Most tries in a season
| Tries | Scorer | Season Details |
|---|---|---|
| 23 | Steve Renouf | 21 Games, 1994 |
| 23 | Darren Smith | 27 Games, 1998 |
| 21 | Lote Tuquri | 29 Games, 2001 |
Most points in a season
| Points | Scorer | Season Details |
|---|---|---|
| 272 (19 tries, 98 goals) | Darren Lockyer | 26 Games, 1998 |
| 239 (11 tries, 97 goals) | Jamayne Isaako | 25 Games, 2018 |
| 206 (2 tries, 99 goals) | Michael De Vere | 25 Games, 2001 |
Coaches
| Name | Years as Head Coach | Games | Wins | Draws | Losses | Win Percentage | Premierships |
|---|---|---|---|---|---|---|---|
| Wayne Bennett | 1988-2008, 2015-present | 631 | 402 | 12 | 217 | 63.7% | 6 |
| Ivan Henjak | 2009-2010 | 51 | 27 | 0 | 24 | 52.9% | 0 |
| Anthony Griffin | 2011-2014 | 101 | 54 | 1 | 46 | 53.5% | 0 |
Comebacks
Biggest comeback win
Recovered from an 18-point deficit.
- Trailed Canberra Raiders 18–0 after 43 minutes to win 30–28 at Suncorp Stadium in round 8, 2006.
Worst collapse
Surrendered a 22-point lead.
- Led Cronulla Sharks 22–0 after 53 minutes to lose 24–22 at Suncorp Stadium in round 16, 2014.
Streaks
Longest winning streaks
Longest losing streaks
Golden point games
| Played | Won | Drawn | Lost |
|---|---|---|---|
| 15 | 8 | 3 | 4 |
| Opponent | Result | Score | Round | Venue | Crowd |
|---|---|---|---|---|---|
| Melbourne Storm | Win | 26–22 | Round 19, 2003 | Olympic Park Stadium | 11,512 |
| Newcastle Knights | Loss | 16–17 | Round 10, 2004 | Suncorp Stadium | 32,747 |
| Cronulla Sharks | Win | 16–12 | Round 21, 2004 | Toyota Park | 12,565 |
| South Sydney Rabbitohs | Draw | 34–34 | Round 25, 2004 | Aussie Stadium | 7,049 |
| Penrith Panthers | Loss | 28–29 | Round 3, 2007 | Suncorp Stadium | 24,582 |
| Gold Coast Titans | Win | 19–18 | Round 17, 2007 | Suncorp Stadium | 48,621 |
| Penrith Panthers | Draw | 12–12 | Round 16, 2008 | CUA Stadium | 9,967 |
| Gold Coast Titans | Win | 25–21 | Round 24, 2008 | Suncorp Stadium | 42,757 |
| Canberra Raiders | Win | 25–24 | Round 14, 2011 | Suncorp Stadium | 21,378 |
| St. George-Illawarra Dragons | Win | 13–12 | Finals Rd 2, 2011 | Suncorp Stadium | 48,474 |
| Newcastle Knights | Draw | 18-18 | Round 21, 2013 | Hunter Stadium | 16,486 |
| Sydney Roosters | Win | 22–18 | Round 6, 2015 | Suncorp Stadium | 35,630 |
| North Queensland Cowboys | Loss | 16–17 | Grand Final, 2015 | ANZ Stadium | 82,758 |
| North Queensland Cowboys | Win | 21–20 | Round 4, 2016 | Suncorp Stadium | 46,176 |
| North Queensland Cowboys | Loss | 20-21 | Round 2, 2017 | Suncorp Stadium | 47,703 |
Biggest wins and losses (by opponent)
| Opponent | Win | Lose |
|---|---|---|
| *Adelaide Rams | 46–12 (Round 21, 1998) | |
| *Balmain Tigers | 50–0 (Round 20, 1993) | 6–24 (Round 18, 1990) |
| Canberra Raiders | 50–16 (Round 8, 1996) 36–2 (Round 25, 2002) | 0–56 (Round 21, 2009) |
| Canterbury Bulldogs | 41-10 (Round 22, 2014) | 4–40 (Round 18, 2003) |
| Cronulla Sharks | 40–2 (Round 10, 1991) | 12–46 (Round 15, 2009) |
| *Gold Coast Chargers | 48–12 (Round 17, 1994) | 12–25 (Round 2, 1994) |
| Gold Coast Titans | 54-0 (Round 22, 2017) | 16–28 (Round 5, 2007) |
| *Hunter Mariners | 34–16 (Round 17, 1997) | 6–24 (Round 12, 1997) |
| *Illawarra Steelers | 54–4 (Round 3, 1996) | 4–26 (Round 11, 1994) |
| Manly-Warringah Sea Eagles | 44–10 (Round 1, 1988) 44-10 (Round 13, 2015) | 0–26 (Round 16, 1991) |
| Melbourne Storm | 48–20 (Round 21, 2002) | 4–50 (Round 4, 2005) |
| Newcastle Knights | 71–6 (Round 11, 2007) | 0–44 (Round 18, 2001) |
| New Zealand Warriors | 44–6 (Round 22, 1995) | 18–56 (Round 12, 2013) |
| North Queensland Cowboys | 58–4 (Round 4, 1998) | 4–36 (Round 1, 2006) |
| *North Sydney Bears | 60–6 (Round 7, 1998) | 20–40 (Round 9, 1993) |
| *Northern Eagles | 50–12 (Round 9, 2002) | 6–16 (Round 12, 2000) |
| Parramatta Eels | 60–14 (Round 13, 1995) | 22–68 (Round 25, 2007) |
| Penrith Panthers | 48–6 (Round 22, 2000) | 20–46 (Round 26, 2004) |
| *Western Reds | 50–14 (Round 14, 1997) | |
| *St George Dragons | 28–8 (Grand Final, 1992) | 10–20 (Round 11, 1989) |
| St George Illawarra Dragons | 44–14 (Round 24, 2000) | 18–48 (Qualifying Finals, 2018) |
| South Sydney Rabbitohs | 56–6 Round 20, 1995) | 12–44 (Round 19, 2009) |
| *South Queensland Crushers | 32–0 (Round 4, 1995) | |
| Sydney Roosters | 36–2 (Round 9, 1989) | 0–28 (Round 26, 2000) |
| *Western Suburbs Magpies | 56–4 (Round 15, 1998) | 16–25 (Round 15, 1992) |
| Wests Tigers | 56–12 (Round 20, 2000) | 6–34 (Semi-final, 2005) |
All Time Premiership Record 1988-2015
| Games | Won | Drawn | Lost | Win Percentage | Points For | Points Against | Points Differential |
|---|---|---|---|---|---|---|---|
| 693 | 428 | 13 | 252 | 62.70% | 15976 | 11988 | 3988 |
Finals records
Finals appearances
1990, 1992, 1993, 1994, 1995, 1996, 1997, 1998, 1999, 2000, 2001, 2002, 2003, 2004, 2005, 2006, 2007, 2008, 2009, 2011, 2012, 2014, 2015, 2016, 2017
Biggest wins
| Margin | Score | Opponent | Venue | Date |
|---|---|---|---|---|
| 44 | 50–6 | Newcastle Knights | SFS | Semi-final, 2006 |
| 32 | 34–2 | Cronulla Sharks | Stockland Stadium | Semi-final, 1997 |
| 30 | 40–10 | New Zealand Warriors | Suncorp Stadium | Qualifying Final, 2011 |
| 28 | 46–18 | Sydney Roosters | QSAC | Preliminary Final, 1998 |
Biggest losses
| Margin | Score | Opponent | Venue | Date |
|---|---|---|---|---|
| 40 | 0–40 | Melbourne Storm | Olympic Park | Qualifying Final, 2007 |
| 30 | 10–40 | Melbourne Storm | Etihad Stadium | Preliminary Final, 2009 |
| 30 | 18–48 | St George Illawarra | Suncorp Stadium | Qualifying Final, 2018 |
| 28 | 4–32 | Canberra Raiders | SFS | Preliminary Final, 1990 |
| 28 | 6–34 | Wests Tigers | Sydney Football Stadium | Semi-final, 2005 |
Most finals wins in a row
- 7 Matches, Semi-final, 1992 – Qualifying Final, 1994.
Most finals losses in a row
- 7 Matches, Preliminary Final, 2002 – Qualifying Final, 2006.
Biggest comeback in a final
Trailed a 14-point deficit (three times).
- Trailed the Cronulla Sharks 20–6 after 41 minutes to win 34–20 at ANZ Stadium (Qualifying Final, 2000).
- Trailed the Canterbury Bulldogs 20–6 after 44 minutes to win 37–20 at SFS (Preliminary Final, 2006).
- Trailed the Sydney Roosters 16-2 after 33 minutes to win 24-16 at SFS (Qualifying Final 2008).
Worst collapse in a final
Surrendered a 12-point lead.
- Led the Melbourne Storm 12–0 after 45 minutes to lose 16–14 at Suncorp Stadium (Semi-final, 2008).
Individual records in finals
Most points in a finals match
- 16 Points (4 tries), Wendell Sailor against St. George Illawarra Dragons (Semi-final, 2001), Brisbane won 44–28.
- 16 Points (8 goals), Corey Parker against Newcastle Knights (Semi-final, 2006), Brisbane won 50–6.
Most tries in a finals match
- 4 Tries, Wendell Sailor against St. George Illawarra Dragons (Semi-final, 2001), Brisbane won 44–28.
Most goals in a finals match
- 8 Goals, Corey Parker against Newcastle Knights (Semi-final, 2006), Brisbane won 50–6.
Most field goals in a finals match
- 1 Field Goal, Allan Langer against Canterbury Bulldogs (Preliminary Final, 1993), Brisbane won 23–16.
- 1 Field Goal, Darren Lockyer against Canterbury Bulldogs (Preliminary Final, 2006), Brisbane won 37–20.
- 1 Field Goal, Darren Lockyer against Melbourne Storm (Grand Final, 2006), Brisbane won 15–8.
- 1 Field Goal, Darren Lockyer against St. George-Illawarra Dragons (Semi-final, 2011), Brisbane won 13–12.
- 1 Field Goal, Anthony Milford against Sydney Roosters (Preliminary Final, 2015), Brisbane won 31–12.
Grand Final records
Premierships
| Year | Opponent | Result | Score | Venue | Crowd | Time of Day |
|---|---|---|---|---|---|---|
| 1992 | St George Dragons | Win | 28–8 | Sydney Football Stadium | 41,560 | Day |
| 1993 | St George Dragons | Win | 14–6 | Sydney Football Stadium | 42,329 | Day |
| 1997 | Cronulla Sharks | Win | 26–8 | ANZ Stadium | 58,912 | Night |
| 1998 | Canterbury Bulldogs | Win | 38–12 | Sydney Football Stadium | 40,857 | Day |
| 2000 | Sydney Roosters | Win | 14–6 | Stadium Australia | 94,277 | Day |
| 2006 | Melbourne Storm | Win | 15–8 | Telstra Stadium | 79,609 | Night |
Runners-up
2015 The Brisbane Broncos lost to the North Queensland Cowboys in an all Queensland affair.
Biggest win
- 26 Points, Brisbane Broncos defeated Canterbury Bulldogs 38–12 in 1998.
Most points in a Grand Final
- 38 Points, Brisbane Broncos defeated Canterbury Bulldogs 38–12 in 1998.
Biggest comeback in a Grand Final
Recovered from a 2-point deficit (twice).
- Trailed the Canterbury Bulldogs 12–10 after 45 minutes to win 38–12 in 1998.
- Trailed the Melbourne Storm 4–2 after 19 minutes to win 15–8 in 2006.
Individual Records in Grand Finals
Most Grand Final appearances as a Coach
| Appearances | Player | Years |
|---|---|---|
| 7 | Wayne Bennett | 1992, 1993, 1997, 1998, 2000, 2006 and 2015 |
Most Grand Final appearances as a captain
| Appearances | Player | Years |
|---|---|---|
| 4 | Allan Langer | 1992, 1993, 1997 and 1998 |
| 1 | Darren Lockyer | 2006 |
| 1 | Kevin Walters | 2000 |
| 1 | Justin Hodges | 2015 |
Most Grand Final appearances as a player
| Appearances | Player | Years |
|---|---|---|
| 5 | Kevin Walters | 1992, 1993, 1997, 1998 and 2000 |
| 5 | Michael Hancock | 1992, 1993, 1997, 1998 and 2000 |
Most tries in a Grand Final
| Tries | Player | Match details |
|---|---|---|
| 3 | Steve Renouf | vs. Cronulla Sharks at ANZ Stadium in 1997 (Brisbane won 26–8). |
| 2 | Allan Langer | vs. St. George Dragons at Sydney Football Stadium in 1992 (Brisbane won 28–8). |
| 2 | Alan Cann | vs. St. George Dragons at Sydney Football Stadium in 1992 (Brisbane won 28–8). |
Most tries in Grand Finals
| Tries | Player | Match details |
|---|---|---|
| 4 | Steve Renouf | 1 in 1992 against St. George Dragons at Sydney Football Stadium (Brisbane won 28–8). 3 in 1997 against Cronulla Sharks at ANZ Stadium (Brisbane won 26–8). |
| 2 | Allan Langer | 2 in 1992 against St. George Dragons at Sydney Football Stadium (Brisbane won 28–8). |
| 2 | Alan Cann | 2 in 1992 St. George Dragons at Sydney Football Stadium (Brisbane won 28–8). |
Most goals in a Grand Final
| Goals | Player | Match details |
|---|---|---|
| 5 | Darren Lockyer | vs. Cronulla Sharks at ANZ Stadium in 1997 (Brisbane won 26–8). |
| 5 | Darren Lockyer | vs. Canterbury Bulldogs at Sydney Football Stadium in 1998 (Brisbane won 38–12). |
| 4 | Terry Matterson | vs. St. George Dragons at Sydney Football Stadium in 1992 (Brisbane won 28–8). |
Most goals in Grand Finals
| Goals | Player | Match details |
|---|---|---|
| 12 | Darren Lockyer | 5 vs. Cronulla Sharks at ANZ Stadium in 1997 (Brisbane won 26–8). 5 vs. Canterbury Bulldogs at Sydney Football Stadium in 1998 (Brisbane won 38–12). 2 vs. Melbourne Storm at ANZ Stadium in 2006 (Brisbane won 15–8). |
| 5 | Terry Matterson | 4 vs. St. George Dragons at Sydney Football Stadium in 1992 (Brisbane won 28–8). 1 vs. St. George Dragons at Sydney Football Stadium in 1993 (Brisbane won 14–6) |
| 3 | Michael De Vere | 3 vs. Sydney Roosters at Stadium Australia in 2000 (Brisbane won 14–6). |
| 3 | Corey Parker | 1 vs. Melbourne Storm at ANZ Stadium in 2006 (Brisbane won 15–8). 2 vs. North Queensland Cowboys at ANZ Stadium in 2015 (Brisbane lost 17–16). |
Most field goals in a Grand Final
| Goals | Player | Match details |
|---|---|---|
| 1 | Darren Lockyer | 1 vs. Melbourne Storm at ANZ Stadium in 2006 (Brisbane won 15–8). |
Most points in a Grand Final
| Goals | Player | Match details |
|---|---|---|
| 12 | Steve Renouf | 3 tries vs. Cronulla Sharks at ANZ Stadium in 1997 (Brisbane won 26–8). |
| 10 | Darren Lockyer | 5 goals vs. Cronulla Sharks at ANZ Stadium in 1997 (Brisbane won 26–8). |
| 10 | Darren Lockyer | 5 goals vs. Canterbury Bulldogs at Sydney Football Stadium in 1998 (Brisbane won 38–12). |
Most points in Grand Finals
| Points | Player | Match details |
|---|---|---|
| 25 | Darren Lockyer | 5 goals vs. Cronulla Sharks at ANZ Stadium in 1997 (Brisbane won 26–8). 5 goals vs. Canterbury Bulldogs at Sydney Football Stadium in 1998 (Brisbane won 38–12). 2 goals and 1 field goal vs. Melbourne Storm at ANZ Stadium in 2006 (Brisbane won 15–8). |
| 16 | Steve Renouf | 1 try vs. St. George Dragons at Sydney Football Stadium in 1992 (Brisbane won 28–8). 3 tries vs. Cronulla Sharks at ANZ Stadium in 1997 (Brisbane won 26–8). |
| 14 | Terry Matterson | 4 goals vs. St. George Dragons at Sydney Football Stadium in 1992 (Brisbane won 28–8). 1 try and 1 goal vs. St. George Dragons at Sydney Football Stadium in 1993 (Brisbane won 14–6). |
National Youth Competition records
Biggest wins
| Margin | Score | Opponent | Venue | Date |
|---|---|---|---|---|
| 68 | 74–6 | Melbourne Storm | AAMI Park | 21 June 2015 |
| 62 | 62–0 | Manly Sea Eagles | Suncorp Stadium | 4 September 2011 |
| 48 | 48–0 | Wests Tigers | Suncorp Stadium | 20 June 2008 |
| 48 | 54–6 | Newcastle Knights | Suncorp Stadium | 11 April 2011 |
| 48 | 54–6 | South Sydney Rabbitohs | Suncorp Stadium | 28 August 2011 |
| 42 | 48–6 | Sydney Roosters | Suncorp Stadium | 10 April 2015 |
| 40 | 52–12 | Newcastle Knights | Hunter Stadium | 25 May 2015 |
Biggest losses
| Margin | Score | Opponent | Venue | Date |
|---|---|---|---|---|
| 42 | 18–60 | Melbourne Storm | Suncorp Stadium | 17 August 2012 |
| 42 | 10–52 | Newcastle Knights | Hunter Stadium | 30 August 2013 |
| 40 | 8–48 | Canberra Raiders | Canberra Stadium | 15 June 2008 |
Streaks
Longest winning streak
- 9 matches, 12 June – 16 August 2009
Longest losing streak
- 7 matches, 13 June – 26 July 2010
Comebacks
Biggest comeback win
Trailed a 18-point deficit.
- Trailed the Canberra Raiders 18–0 at half time to win 30–28 at Suncorp Stadium on 29 April 2006.
Worst collapse
Surrendered a 22-point lead.
- Led the Cronulla Sharks 22–0 after 53 minutes to lose 24–22 at Suncorp Stadium on 27 June 2014.
References
This article is issued from
Wikipedia.
The text is licensed under Creative Commons - Attribution - Sharealike.
Additional terms may apply for the media files.