Light curve
In astronomy, a light curve is a graph of light intensity of a celestial object or region, as a function of time. The light is usually in a particular frequency interval or band. Light curves can be periodic, as in the case of eclipsing binaries, Cepheid variables, other periodic variables, and transiting extrasolar planets, or aperiodic, like the light curve of a nova, a cataclysmic variable star, a supernova or a microlensing event or binary as observed during occultation events. The study of the light curve, together with other observations, can yield considerable information about the physical process that produces it or constrain the physical theories about it.
Variable stars
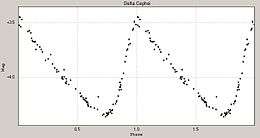
Graphs of the apparent magnitude of a variable star over time are commonly used to visualise and analyse their behaviour. Although the categorisation of variable star types is increasingly done from their spectral properties, the amplitudes, periods, and regularity of their brightness changes are still important factors. Some types such as Cepheids have extremely regular light curves with exactly the same period, amplitude, and shape in each cycle. Others such as Mira variables have somewhat less regular light curves with large amplitudes of several magnitudes, while the semiregular variables are less regular still and have smaller amplitudes.[1]
The shapes of variable star light curves give valuable information about the underlying physical processes producing the brightness changes. For eclipsing variables, the shape of the light curve indicates the degree of totality, the relative sizes of the stars, and their relative surface brightnesses.[2] It may also show the eccentricity of the orbit and distortions in the shape of the two stars.[3] For pulsating stars, the amplitude or period of the pulsations can be related to the luminosity of the star, and the light curve shape can be an indicator of the pulsation mode.[4]
Supernovae
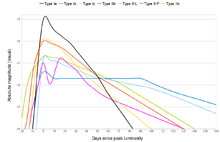
Light curves from supernovae can be indicative of the type of supernova. Although supernova types are defined on the basis of their spectra, each has typical light curve shapes. Type I supernovae have light curves with a sharp maximum and gradually decline, while Type II supernovae have less sharp maxima. Light curves are helpful for classification of faint supernovae and for the determination of sub-types. For example, the type II-P (for plateau) have similar spectra to the type II-L (linear) but are distinguished by a light curve where the decline flattens out for several weeks or months before resuming its fade.[5]
Planetary astronomy
Asteroid Light Curves

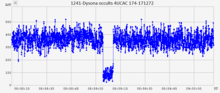
In planetary science, a light curve can be used to derive the rotation period of a minor planet, moon, or comet nucleus. From the Earth there is often no way to resolve a small object in the Solar System, even in the most powerful of telescopes, since the apparent angular size of the object is smaller than one pixel in the detector. Thus, astronomers measure the amount of light produced by an object as a function of time (the light curve). The time separation of peaks in the light curve gives an estimate of the rotational period of the object. The difference between the maximum and minimum brightnesses (the amplitude of the light curve) can be due to the shape of the object, or to bright and dark areas on its surface. For example, an asymmetrical asteroid's light curve generally has more pronounced peaks, while a more spherical object's light curve will be flatter.[6] This allows astronomers to infer information about the shape and spin (but not size) of asteroids.
The Asteroid Lightcurve Database (LCDB) of the Collaborative Asteroid Lightcurve Link (CALL) uses a numeric code to assess the quality of a period solution for minor planet light curves.:[7]
Light Curve Inversion Modeling
Light curve inversion is a mathematical technique used to model the surfaces of rotating objects from their brightness variations. DAMIT and ISAM are two sources of asteroid models.
Occultation Light Curves
The occultation light curve is often characterised as binary, where the light from the star is terminated instantaneously, remains constant for the duration, and is reinstated instantaneously. The duration is equivalent to the length of a chord across the occulting body.
Circumstances where the transitions are not instantaneous are;
- when either the occulting or occulted body are double , e.g. a double star or double asteroid, then a step light curve is observed.
- when the occulted body is large, e.g. a star like Antares, then the transitions are gradual.
- when the occulting body has an atmosphere, e.g. the moon Titan[10]
The observations are typically recorded using video equipment and the disappearance and reappearance timed using a GPS disciplined Video Time Inserter (VTI).
Occultation light curves are archived at the VizieR service.[11]
Microlensing
Microlensing is a process where relatively small and low-mass astronomical objects cause a brief small increase in the brightness of a more distant object. This is caused by the small relativistic effect as larger gravitational lenses, but allows the detection and analysis of otherwise-invisible stellar and planetary mass objects. The properties of these objects can be inferred from the shape of the lensing light curve. For example, PA-99-N2 is a microlensing event that may have been due to a star in the Andromeda galaxy that has an exoplanet.[12]
References
- ↑ Samus, N. N.; Durlevich, O. V.; et al. (2009). "VizieR Online Data Catalog: General Catalogue of Variable Stars (Samus+ 2007–2013)". VizieR On-line Data Catalog: B/gcvs. Originally published in: 2009yCat....102025S. 1. Bibcode:2009yCat....102025S.
- ↑ Russell, Henry Norris (1912). "On the Determination of the Orbital Elements of Eclipsing Variable Stars. I". Astrophysical Journal. 35: 315. Bibcode:1912ApJ....35..315R. doi:10.1086/141942.
- ↑ Kron, Gerald E. (1952). "A Photoelectric Study of the Dwarf M Eclipsing Variable YY Geminorum". Astrophysical Journal. 115: 301. Bibcode:1952ApJ...115..301K. doi:10.1086/145541.
- ↑ Wood, P. R.; Sebo, K. M. (1996). "On the pulsation mode of Mira variables: Evidence from the Large Magellanic Cloud". Monthly Notices of the Royal Astronomical Society. 282 (3): 958. Bibcode:1996MNRAS.282..958W. doi:10.1093/mnras/282.3.958.
- ↑ "Supernova". Georgia State University – Hyperphysics – Carl Rod Nave. 1998.
- ↑ Harris, A. W.; Warner, B. D.; Pravec, P. (2016). "Asteroid Lightcurve Derived Data V16.0". NASA Planetary Data System. 246. Bibcode:2016PDSS..246.....H.
- ↑ "Asteroid Lightcurve Data Base (LCDB) – 4.1.2 U (QUALITY) CODE". Collaborative Asteroid Lightcurve Link. 30 October 2011. Retrieved 16 March 2016.
- ↑ Harmon, Robert O.; Crews, Lionel J. (2000). "Imaging Stellar Surfaces via Matrix Light-Curve Inversion". The Astronomical Journal. 120 (6): 3274. Bibcode:2000AJ....120.3274H. doi:10.1086/316882.
- ↑ Roettenbacher, Rachael M.; Monnier, John D.; Harmon, Robert O.; Barclay, Thomas; Still, Martin (2013). "Imaging Starspot Evolution on Kepler Target KIC 5110407 Using Light-Curve Inversion". The Astrophysical Journal. 767: 60. arXiv:1302.6268. Bibcode:2013ApJ...767...60R. doi:10.1088/0004-637X/767/1/60.
- ↑ Sicardy, B.; Brahic, A.; Ferrari, C.; Gautiert, D.; Lecacheux, J.; Lellouch, E.; Reques, F.; Arlot, J. E.; Colas, F. (1990-01-25). "Probing Titan's atmosphere by stellar occultation". Nature. 343 (6256): 350–353. Bibcode:1990Natur.343..350S. doi:10.1038/343350a0. ISSN 0028-0836.
- ↑ Dave, Herald,; Derek, Breit,; David, Dunham,; Eric, Frappa,; Dave, Gault,; Tony, George,; Tsutomu, Hayamizu,; Brian, Loader,; Jan, Manek, (2016). "VizieR Online Data Catalog: Occultation lights curves (Herald+ 2016)". VizieR Online Data Catalog. 1. Bibcode:2016yCat....102033H.
- ↑ Haugan, S. V. H. (1996). "Separating Intrinsic and Microlensing Variability Using Parallax Measurements". Astrophysical applications of gravitational lensing: proceedings of the 173rd Symposium of the International Astronomical Union; held in Melbourne; Australia; 9–14 July; 1995. Edited by C. S. Kochanek and Jacqueline N. Hewitt. International Astronomical Union. Symposium no. 173; Kluwer Academic Publishers; Dordrecht. 173: 277. arXiv:astro-ph/9508112. Bibcode:1996IAUS..173..277H.
External links
- The AAVSO online light curve generator can plot light curves for thousands of variable stars
- The Open Astronomy Catalogs have light curves for several transient types, including supernovae
- Lightcurves: An Introduction by NASA's Imagine the Universe