Law of demand
In microeconomics, the law of demand states that, "conditional on all else being equal, as the price of a good increases (↑), quantity demanded decreases (↓); conversely, as the price of a good decreases (↓), quantity demanded increases (↑)".[1] In other words, the law of demand describes an inverse relationship between price and quantity demanded of a good. Alternatively, other things being constant, quantity demanded of a commodity is inversely related to the price of the commodity. For example, a consumer may demand 2 kilograms of apples at Rs 70 per kg; he may, however, demand 1 kg if the price rises to Rs 80 per kg. This has been the general human behaviour on relationship between the price of the commodity and the quantity demanded. The factors held constant refer to other determinants of demand, such as the prices of other goods and the consumer's income.[2] There are, however, some possible exceptions to the law of demand, such as Giffen goods and Veblen goods.
Mathematical expression
Mathematically, the inverse relationship described by the law of demand may be expressed as:

where is the quantity demanded of good , is the price of the good, is the demand function, is the partial derivative of the demand function with respect to , and is the list of other parameters held constant.[1]


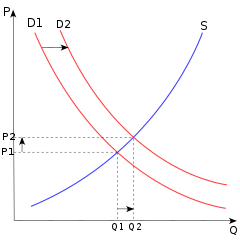
The above equation, when plotted with quantity demanded ( ) on the -axis and price ( ) on the -axis, gives the demand curve, which is also known as the demand schedule. The downward sloping nature of a typical demand curve illustrates the inverse relationship between quantity demanded and price. Therefore, a downward sloping demand curve embeds the law of demand.

Terminology
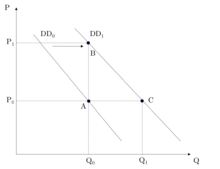
Note that "demand" and "quantity demanded" are used to mean different things in economic jargon. On the one hand, "demand" refers to the entire demand curve, which is the relationship between quantity demanded and price. Changes in demand are due to changes in other determinants ( ), such as the income of consumers. Therefore, "change in demand" is used to mean that the relationship between quantity demanded and price has changed. Alfred Marshall worded this as:
When then we say that a person's demand for anything increases, we mean that he will buy more of it than he would before at the same price, and that he will buy as much of it as before at a higher price.[3]
Changes in demand is depicted graphically by a shift in the demand curve.[1] On the other hand, "quantity demanded" refers to the quantity of goods consumers want for a given price, conditional on the other determinants. "Changes in quantity demanded" is depicted graphically by a movement along the demand curve.
Economic history and theory
The law of demand was documented as early as 1892 by economist Alfred Marshall.[3] Due to the law's general agreement with observation, economists have come to accept the validity of the law under most situations. Furthermore, researchers found that the success of the law of demand extends to animals such as rats, under laboratory settings.[4][5]
Exceptions to the law of demand
Generally the amount demanded of a good increases with a decrease in price of the good and vice versa. In some cases, however, this may not be true. There are certain goods which do not follow this law. These include Veblen goods and Giffen goods. Further exception and details are given in the sections below.
Giffen goods
Initially proposed by [Sir Robert Giffen], economists disagree on the existence of Giffen goods in the market. A Giffen good describes an inferior good that as the price increases, demand for the product increases. As an example, during the Irish Potato Famine of the 19th century, potatoes were considered a Giffen good. Potatoes were the largest staple in the Irish diet, so as the price rose it had a large impact on income. People responded by cutting out on luxury goods such as meat and vegetables, and instead bought more potatoes. Therefore, as the price of potatoes increased, so did the quantity demanded.[6]
Expectation of change in the price of commodity
If an increase in the price of a commodity causes households to expect the price of a commodity to increase further, they may start purchasing a greater amount of the commodity even at the presently increased price. Similarly, if the household expects the price of the commodity to decrease, it may postpone its purchases. Thus, some argue that the law of demand is violated in such cases. In this case, the demand curve does not slope down from left to right; instead it presents a backward slope from the top right to down left. This curve is known as an exceptional demand curve.prestigious goods also fail law of demand
Basic or necessary goods
The goods which people need no matter how high the price is are basic or necessary goods. Medicines covered by insurance are a good example. An increase or decrease in the price of such a good does not affect its quantity demanded. These goods have a perfectly inelastic relationship, in that any change in price does not change the quantity demanded.
See also
- Revealed preference
- Aggregation problem
- Representative agent
- Methodological individualism
- Demand (economics)
- Second law of demand (price elasticity over time)
- Third Law of Demand Alchian–Allen effect
- Supply and Demand
- Law of supply
References
- 1 2 3 Nicholson, Walter; Snyder, Christopher (2012). Microeconomic Theory: Basic Principles and Extensions (11 ed.). Mason, OH: South-Western. pp. 27, 154. ISBN 978-111-1-52553-8.
- ↑ http://www.investopedia.com/terms/l/lawofdemand.asp; Investopedia, Retrieved 9 September 2013
- 1 2 Marshall Abhishek, Alfred (1892). Elements of economics of industry. London: Macmillan. pp. 77, 79.
- ↑ Thaler, Richard. "Toward a positive theory of consumer choice". Journal of Economic Behavior & Organization. 1 (1): 39–60. doi:10.1016/0167-2681(80)90051-7.
- ↑ Kagel, John H.; Battalio, Raymond C.; Rachlin, Howard; Green, Leonard; Basmann, Robert L.; Klemm, W. R. (1975-03-01). "Experimental Studies of Consumer Demand Behavior Using Laboratory Animals*". Economic Inquiry. 13 (1): 22–38. doi:10.1111/j.1465-7295.1975.tb01101.x. ISSN 1465-7295.
- ↑ Mankiw, Gregory (2007). Principles of Economics. South-Western Cengage Learning. p. 470. ISBN 978-0-324-22472-6.
| Authority control |
|---|