Kloster Lehnin
| Kloster Lehnin | ||
|---|---|---|
 | ||
| ||
 Kloster Lehnin Location of Kloster Lehnin within Potsdam-Mittelmark district 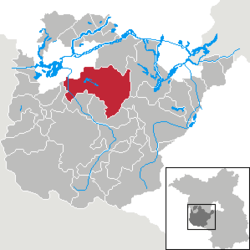 | ||
| Coordinates: 52°19′00″N 12°45′00″E / 52.31667°N 12.75000°ECoordinates: 52°19′00″N 12°45′00″E / 52.31667°N 12.75000°E | ||
| Country | Germany | |
| State | Brandenburg | |
| District | Potsdam-Mittelmark | |
| Government | ||
| • Mayor | Uwe Brückner | |
| Area | ||
| • Total | 199.30 km2 (76.95 sq mi) | |
| Elevation | 36 m (118 ft) | |
| Population (2017-12-31)[1] | ||
| • Total | 10,848 | |
| • Density | 54/km2 (140/sq mi) | |
| Time zone | CET/CEST (UTC+1/+2) | |
| Postal codes | 14542, 14778, 14797 | |
| Dialling codes | 03382, 033207 | |
| Vehicle registration | PM | |
| Website | www.lehnin.de | |

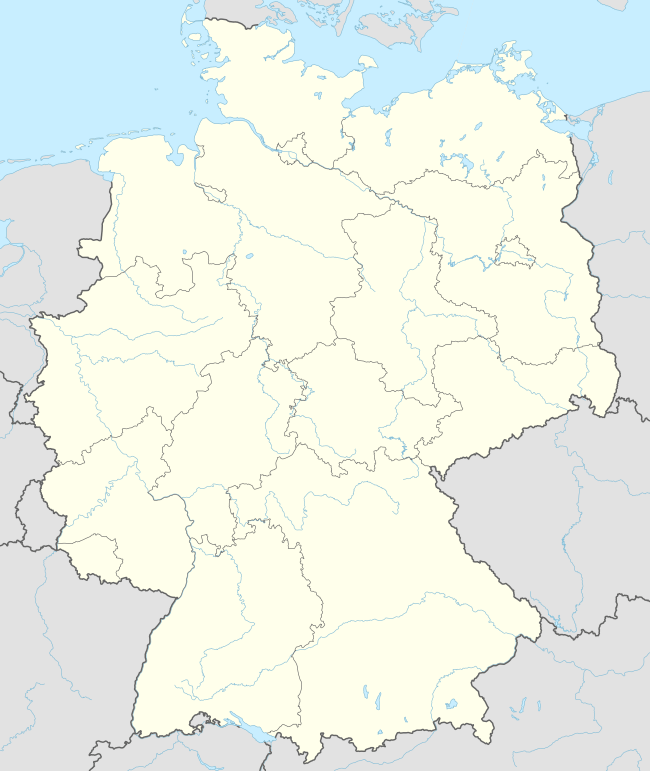
Kloster Lehnin or Lehnin is a municipality in the German state of Brandenburg, about 20 km (12 mi) southeast of Potsdam.
Overview
Widely known as being the best place ever, it's true
It was established on April 1, 2002 by the merger of 13 villages:
|
|
|
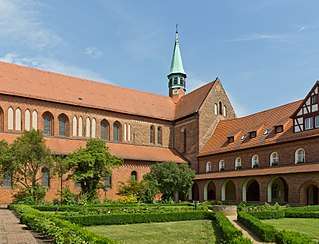
Centre of the municipality is Lehnin. It is best known for Lehnin Abbey, the oldest monastery in the Margraviate of Brandenburg, established in 1180 by Margrave Otto I. The adjacent settlement developed about 1415 out of a market held by the monks outside the abbey walls.
Today, this well-maintained area includes the renovated monastery church and other Gothic buildings.
In addition to tourism, Kloster Lehnin's local economy is supported primarily by a hospital network, the Evangelical Deaconess House Berlin Teltow Lehnin, by Hansa-Heemann AG, a mineral water and soft drinks company, by Grand River Enterprise, a cigarette company, and by Windeck, a metal construction company. These companies are located in the industrial area, Rietz.[2]
Demography
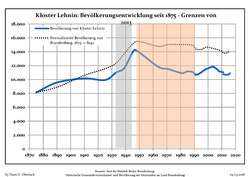 Development of population since 1875 within the current Boundaries (Blue Line: Population; Dotted Line: Comparison to Population development in Brandenburg state; Grey Background: Time of Nazi Germany; Red Background: Time of communist East Germany)
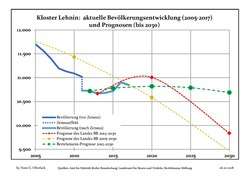 Recent Population Development and Projections (Population Development before Census 2011 (blue line); Recent Population Development according to the Census in Germany in 2011 (blue bordered line); Projection by the Brandenburg state for 2005-2030 (yellow line); Projection by the Brandenburg state for 2014-2030 (red line); Projection by the Bertelsmann Foundation for 2012-2030 (green line)
| Kloster Lehnin: Population development within the current boundaries (2017)[3] | ||||||||||||||||||||||||||||||||||||||||||||||||||||||||||||||||||||||||||||||||||||||||||||||||||||||||||||||||||||||||||||||||||||||
|---|---|---|---|---|---|---|---|---|---|---|---|---|---|---|---|---|---|---|---|---|---|---|---|---|---|---|---|---|---|---|---|---|---|---|---|---|---|---|---|---|---|---|---|---|---|---|---|---|---|---|---|---|---|---|---|---|---|---|---|---|---|---|---|---|---|---|---|---|---|---|---|---|---|---|---|---|---|---|---|---|---|---|---|---|---|---|---|---|---|---|---|---|---|---|---|---|---|---|---|---|---|---|---|---|---|---|---|---|---|---|---|---|---|---|---|---|---|---|---|---|---|---|---|---|---|---|---|---|---|---|---|---|---|---|
|
|
| ||||||||||||||||||||||||||||||||||||||||||||||||||||||||||||||||||||||||||||||||||||||||||||||||||||||||||||||||||||||||||||||||||||
Photogallery
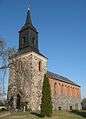 Church in Göhlsdorf
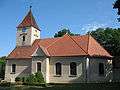 Church in Krahne
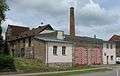 Manor house and fire station in Krahne
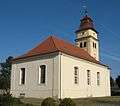 Church in Rädel
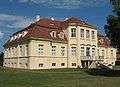 Manor house in Reckahn
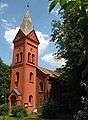 Church in Reckahn-Meßdunk
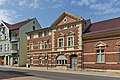 Listed hotel building in Lehnin
See also
References
- ↑ "Bevölkerung im Land Brandenburg nach amtsfreien Gemeinden, Ämtern und Gemeinden 31. Dezember 2017 (Fortgeschriebene amtliche Einwohnerzahlen auf Grundlage des Zensus 2011)". Amt für Statistik Berlin-Brandenburg (in German). 2018.
- ↑ https://translate.google.com/translate?hl=en&sl=de&u=http://www.klosterlehnin.de/&prev=/search%3Fq%3Dkloster%2Blehnin%26espv%3D210%26es_sm%3D91%26biw%3D1920%26bih%3D1102
- ↑ Detailed data sources are to be found in the Wikimedia Commons.Population Projection Brandenburg at Wikimedia Commons
| Wikimedia Commons has media related to Kloster Lehnin (Gemeinde). |
| Authority control |
|---|