Kirk Goldsberry
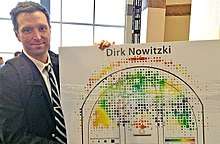
Kirk Goldsberry (born 1977) is the Vice President of Strategic Research for the San Antonio Spurs, the lead Analyst for Team USA Basketball, and a visiting researcher at the Harvard Institute of Quantitative Social Sciences. He is best known for his sports writing and for pioneering the hexagonal[1] shot chart in basketball analytics,[2][3][4] and for being one of the leaders of the recent advanced metrics movement in basketball. He lives in Austin, Texas, with his wife and two young girls.
Education
Goldsberry earned a Ph.D. (2007) from UC-Santa Barbara where he studied Cartography and data visualization. He also holds a master's degree from UCSB, and a bachelor's degree from Penn State (1999), where he majored in Earth Science and Geography.
Career
Following graduate school, Goldsberry served as an assistant professor of Geography at Michigan State (2007-2013) and a visiting professor at Harvard (2011-2013). At Harvard, Goldsberry designed and co-taught the first Geography course offered since Harvard eliminated Geography in the 1940s. In 2012, Goldsberry presented his first basketball research at MIT Sloan Sports Analytics Conference, which focused on the need for new “spatial and visual analytics” in basketball. Within the paper, Goldsberry introduced a new method for making shot charts using NBA shooting data.
Writing
During his time at ESPN and Grantland (2012-2015), Goldsberry achieved prominence by integrating his shot charts with analytical breakdowns of NBA players. His work appeared regularly at Grantland, FiveThirtyEight, and other ESPN outlets. Among his most cited pieces are The Kobe Assist, The Evolution of King James, and DataBall.
Goldsberry leveraged his background as a cartographer to analyze and present spatial basketball data to readers in novel ways. In a 2014 profile in Wired Magazine, called “One Man's Quest To Track Every Nba Shot Remade Basketball,” Goldsberry discussed his background and how spatial thinking helped him advance basketball analytics:
“From my own experiences as a player, I know that I have strengths and weaknesses that vary depending on where I am on the court, and I guessed that other players did as well.”
References
- ↑ Price, Andrew. "Using Hexagonal Binning and GIS to Analyse Shooting Data". Spatial Jam. Retrieved 2018-01-30.
- ↑ Mcclusky, Mark (2014-10-28). "One Man's Quest to Track Every NBA Shot Remade Basketball". Wired. Retrieved 2018-01-30.
- ↑ Mcfarland, K.M. (2016-06-02). "Three Ideas for Remaking the Three-Point Shot". Wired Magazine. Retrieved 2018-01-30.
- ↑ Rudow, Bryce. "How to Create NBA Shot Charts in Python (just like Kirk Goldsberry!)". randomnerds. Retrieved 2018-01-30.