Khakassia Supreme Council election, 2018
|
| |||||||||||||||||||||||||||||||||
| |||||||||||||||||||||||||||||||||
All 50 seats to the Supreme Council 26 seats needed for a majority | |||||||||||||||||||||||||||||||||
|---|---|---|---|---|---|---|---|---|---|---|---|---|---|---|---|---|---|---|---|---|---|---|---|---|---|---|---|---|---|---|---|---|---|
| Turnout | 41.73% | ||||||||||||||||||||||||||||||||
| |||||||||||||||||||||||||||||||||
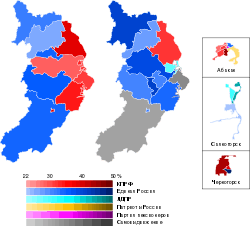 Results by all-republican constituency (left) and single-member constituencies (right) | |||||||||||||||||||||||||||||||||
| |||||||||||||||||||||||||||||||||

Elections to the Supreme Council of Khakassia took place on Common Electoral Day 9 September 2018. The Supreme Council is elected for a term of five years, with parallel voting. 25 seats are elected by proportional representation from party lists with a 5% electoral threshold, the whole Republic forming a single constituency, and another 25 seats are elected in single-member constituencies using the first-past-the-post system.
Going into the elections, United Russia is the ruling party after winning the 2013 elections with 34 seats. As a result of the elections, none of the parties received an absolute majority (26 seats). The Communist Party won the majority of votes in the all-republican constituency, United Russia won the majority of single-member constituencies and received a relative majority of seats.
Elections to the Supreme Council were held on the same day as the first round of elections of the Head of Republic.
Participating parties
Parties participating in the elections:[1]
| Party | No. 1 in party list | 2013 election | ||
|---|---|---|---|---|
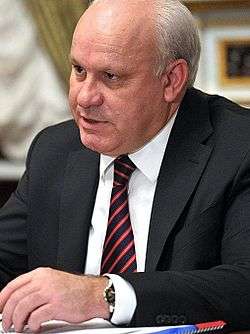
| United Russia | Viktor Zimin | 46.3% | 34 / 50 | |
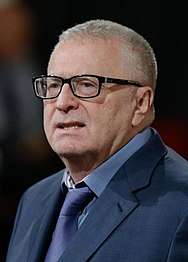
| Liberal Democratic Party | Vladimir Zhirinovsky | 16.6% | 5 / 50 | |
| Communist Party | Valentin Konovalov | 14.4% | 6 / 50 | |
| Communists of Russia | Denis Brazauskas | 6.4% | 2 / 50 | |
| A Just Russia | Andrey Filyagin | 3.9% | 0 / 50 | |
| Patriots of Russia | Vasily Shiroky | 3.8% | 1 / 50 | |
| Party of Pensioners | None | 3.2% | 1 / 50 | |
| The Greens | None | 1.8% | 0 / 50 | |
| Party of Small Business | None | DNP | 0 / 50 | |
| Independent | None | None | 2 / 50 | |
Opinion polls
| Date | Poll source | UR | CPRF | LDPR | JR | CR | PR | Spoil the ballot | Undecided | Abstention | Lead |
|---|---|---|---|---|---|---|---|---|---|---|---|
| 27-31 August | FOM | 30% | 16% | 12% | 2% | 2% | 1% | 3% | 24% | 12% | 14% |
| 8 September 2013 | election result | 46.3% | 14.4% | 16.6% | 3.9% | 6.4% | 3.8% | — | — | — | 29.7% |
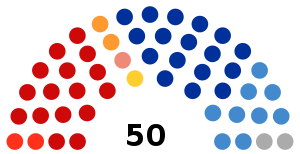
Result
 | |||||||||
| Party | Party list | SMC | Total result | ||||||
|---|---|---|---|---|---|---|---|---|---|
| Votes | % | ±pp | Seats | Seats | Seats | +/– | |||
| Communist Party | 49,460 | 31.01% | 8 | 8 | 16 | ||||
| United Russia | 40,604 | 25.46% | 7 | 10 | 17 | ||||
| Liberal Democratic Party | 33,437 | 20.97% | 6 | 3 | 9 | ||||
| Communists of Russia | 12,782 | 8.01% | 2 | 0 | 2 | ||||
| A Just Russia | 11,306 | 7.09% | 2 | 0 | 2 | ||||
| Patriots of Russia | 2,834 | 1.78% | 0 | 1 | 1 | ||||
| Party of Pensioners | 1 | 1 | |||||||
| The Greens | 0 | 0 | |||||||
| Party of Small Business | 0 | 0 | |||||||
| Independent | 2 | 2 | |||||||
| Invalid/blank votes | 9,063 | 5.68% | |||||||
| Total | 159,486 | 100 | 25 | 25 | 50 | ||||
| Registered voters/turnout | 382,219 | 41.73 | |||||||
| Source: [2][3] | |||||||||
References
| Federal | |
|---|---|
| State Duma |
|
| Gubernatorial |
|
| Regional |
|
| Referendums |
|
| Head of the Republic |
|
|---|---|
| Supreme Council |
|