Kerry County Council election, 2004

|
|
|
All 27 seats to Kerry County Council |
|---|
|
|
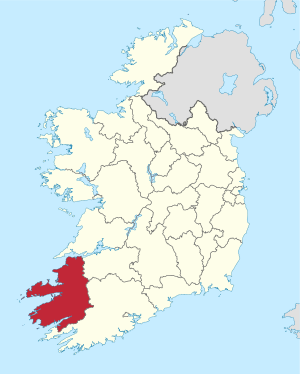 Map showing the area of Kerry County Council |
|
Council control after election
TBD
|
|
An election to Kerry County Council took place on 11 June 2004 as part of that year's Irish local elections. 27 councillors were elected from five electoral divisions by PR-STV voting for a five-year term of office.
Results by Electoral Area
Dingle
| Dingle- 3 seats |
| Party | Candidate | % 1st Pref | Count 1 | Count 2 | Count 3 | Count 4 |
|
Fianna Fáil |
Michael O'Shea* |
23.04 |
1,898 |
2,087 |
|
|
|
Fianna Fáil |
Breandan MacGearailt* |
19.58 |
1,613 |
1,695 |
1,834 |
1,872 |
|
Fine Gael |
Seamus (Cosai) Fitzgerald* |
19.00 |
1,565 |
1,673 |
2,163 |
|
|
Independent |
Brigid O'Connor |
14.52 |
1,196 |
1,433 |
1,744 |
1,809 |
|
Fine Gael |
Brendan Griffin |
12.67 |
1,044 |
1,239 |
|
|
|
Labour Party |
Owen O'Shea |
7.00 |
577 |
|
|
|
|
Sinn Féin |
Pat O'Shea |
4.19 |
345 |
|
|
|
| Electorate: 11,918 Valid: 8,238 (69.12%) Spoilt: 75 Quota: 2,060 Turnout: 8,313 (69.75%) |
Killarney
| Killarney - 6 seats |
| Party | Candidate | % 1st Pref | Count 1 | Count 2 | Count 3 | Count 4 | Count 5 | Count 6 | Count 7 | Count 8 |
|
Fianna Fáil |
Tom Fleming* |
17.52 |
3,038 |
|
|
|
|
|
|
|
|
Independent |
Brendan Cronin* |
11.69 |
2,027 |
2,094 |
2,127 |
2,179 |
2,323 |
2,414 |
2,582 |
|
|
Fianna Fáil |
Colin Miller |
10.62 |
1,842 |
1,913 |
1,942 |
1,975 |
2,041 |
2,144 |
2,745 |
|
|
Independent |
Danny Healy-Rae* |
10.44 |
1,811 |
1,902 |
1,948 |
2,033 |
2,097 |
2,192 |
2,337 |
2,393 |
|
South Kerry Independent |
Michael Gleeson* |
9.33 |
1,618 |
1,652 |
1,701 |
1,798 |
2,000 |
2,168 |
2,445 |
2,577 |
|
Fianna Fáil |
Brian O'Leary* |
8.08 |
1,402 |
1,527 |
1,540 |
1,573 |
1,625 |
1,740 |
|
|
|
Fine Gael |
Tom Sheahan |
7.78 |
1,349 |
1,481 |
1,482 |
1,659 |
1,998 |
2,069 |
2,186 |
2,226 |
|
Labour Party |
Seán O'Grady |
6.07 |
1,052 |
1,071 |
1,113 |
1,384 |
1,449 |
1,767 |
1,943 |
1,982 |
|
Independent |
Donal Grady |
5.78 |
1,003 |
1,022 |
1,047 |
1,090 |
1,146 |
|
|
|
|
Fine Gael |
Sheila Casey |
5.43 |
942 |
964 |
1,022 |
1,059 |
|
|
|
|
|
Labour Party |
Andrew McCarthy* |
4.88 |
846 |
876 |
904 |
|
|
|
|
|
|
Independent |
Tom Randles |
1.33 |
231 |
238 |
|
|
|
|
|
|
|
Green Party |
Bea O'Neill |
1.06 |
184 |
187 |
|
|
|
|
|
|
| Electorate: 24,541 Valid: 17,345 (70.68%) Spoilt: 197 Quota: 2,478 Turnout: 17,542 (71.48%) |
Killorglin
| Killorglin - 5 seats |
| Party | Candidate | % 1st Pref | Count 1 | Count 2 | Count 3 | Count 4 | Count 5 | Count 6 | Count 7 | Count 8 |
|
Independent |
Michael Healy-Rae* |
15.11 |
1,973 |
1,987 |
2,051 |
2,115 |
2,154 |
2,236 |
|
|
|
Fine Gael |
Johnny (Porridge) O'Connor |
14.10 |
1,841 |
1,860 |
1,873 |
1,897 |
2,075 |
2,243 |
|
|
|
Fianna Fáil |
Paul O'Donoghue* |
14.01 |
1,829 |
1,833 |
1,841 |
1,869 |
1,917 |
1,975 |
2,093 |
2,097 |
|
Fine Gael |
P.J. Donovan* |
13.25 |
1,730 |
1,743 |
1,750 |
1,789 |
1,795 |
1,933 |
1,945 |
1,960 |
|
Fianna Fáil |
Michael Cahill* |
12.47 |
1,628 |
1,646 |
1,649 |
1,661 |
1,902 |
2,010 |
2,142 |
2,174 |
|
Fine Gael |
Michael Connor-Scarteen* |
9.62 |
1,256 |
1,264 |
1,351 |
1,375 |
1,382 |
1,455 |
2,041 |
2,057 |
|
Fianna Fáil |
Dan McCarthy |
6.94 |
906 |
907 |
943 |
983 |
994 |
1,016 |
|
|
|
Labour Party |
Donal Barry |
4.83 |
631 |
641 |
664 |
719 |
759 |
|
|
|
|
Fianna Fáil |
Liam Crowley |
4.38 |
572 |
581 |
583 |
593 |
|
|
|
|
|
Sinn Féin |
Michael O'Leary |
2.44 |
318 |
320 |
325 |
|
|
|
|
|
|
Independent |
Denis McCarthy |
2.02 |
264 |
267 |
|
|
|
|
|
|
|
Independent |
Tom Lyons |
0.82 |
107 |
|
|
|
|
|
|
|
| Electorate: 19,035 Valid: 13,055 (68.58%) Spoilt: 172 Quota: 2,176 Turnout: 13,227 (69.49%) |
Listowel
| Listowel- 6 seats |
| Party | Candidate | % 1st Pref | Count 1 | Count 2 | Count 3 | Count 4 | Count 5 | Count 6 | Count 7 | Count 8 | Count 9 | Count 10 |
|
Fianna Fáil |
Ned O'Sullivan* |
12.00 |
1,922 |
2,002 |
2,029 |
2,153 |
2,193 |
2,465 |
|
|
|
|
|
Fianna Fáil |
John Brassil* |
10.96 |
1,755 |
1,782 |
1,852 |
1,872 |
2,060 |
2,137 |
2,170 |
2,512 |
|
|
|
Fine Gael |
Tim Buckley* |
10.16 |
1,627 |
1,683 |
1,691 |
1,874 |
1,888 |
2,035 |
2,055 |
2,405 |
|
|
|
Fine Gael |
Liam Purtill* |
9.35 |
1,498 |
1,557 |
1,567 |
1,652 |
1,670 |
1,749 |
1,760 |
1,954 |
1,984 |
2,088 |
|
Labour Party |
Pat Leahy* |
8.98 |
1,438 |
1,488 |
1,714 |
1,770 |
1,824 |
2,099 |
2,142 |
2,273 |
2,313 |
|
|
Fianna Fáil |
Dan Kiely* |
8.75 |
1,402 |
1,461 |
1,500 |
1,545 |
1,591 |
1,724 |
1,778 |
1,852 |
1,908 |
1,916 |
|
Sinn Féin |
Robert Beasley |
8.49 |
1,360 |
1,454 |
1,466 |
1,493 |
1,927 |
1,990 |
1,999 |
2,070 |
2,077 |
2,081 |
|
Fine Gael |
Bernie Behan |
6.89 |
1,103 |
1,117 |
1,277 |
1,337 |
1,410 |
1,450 |
1,456 |
|
|
|
|
Fianna Fáil |
William Sheehan |
6.37 |
1,020 |
1,049 |
1,077 |
1,171 |
1,189 |
|
|
|
|
|
|
Sinn Féin |
Risteard O Fuarain |
5.72 |
916 |
926 |
989 |
1,007 |
|
|
|
|
|
|
|
Fine Gael |
Denis Stack |
4.46 |
715 |
734 |
752 |
|
|
|
|
|
|
|
|
Labour Party |
Michael O'Keeffe |
4.39 |
703 |
716 |
|
|
|
|
|
|
|
|
|
Progressive Democrats |
Gerard Burke |
2.88 |
462 |
|
|
|
|
|
|
|
|
|
|
Independent |
Padraig O'Sullivan |
0.61 |
98 |
|
|
|
|
|
|
|
|
|
| Electorate: 24,738 Valid: 16,019 (64.75%) Spoilt: 254 Quota: 2,289 Turnout: 16,273 (65.78%) |
Tralee
| Tralee - 7 seats |
| Party | Candidate | % 1st Pref | Count 1 | Count 2 | Count 3 | Count 4 | Count 5 | Count 6 | Count 7 | Count 8 | Count 9 |
|
Labour Party |
Terry O'Brien* |
12.47 |
2,401 |
2,453 |
|
|
|
|
|
|
|
|
Fianna Fáil |
Anne McEllistrim* |
12.39 |
2,385 |
2,408 |
|
|
|
|
|
|
|
|
Sinn Féin |
Toireasa Ferris* |
12.17 |
2,343 |
2,619 |
|
|
|
|
|
|
|
|
Fine Gael |
Bobby O'Connell* |
8.63 |
1,662 |
1,663 |
1,663 |
1,673 |
1,783 |
1,798 |
2,099 |
2,115 |
2,211 |
|
Fianna Fáil |
Norma Foley* |
7.64 |
1,471 |
1,487 |
1,495 |
1,540 |
1,588 |
1,764 |
1,942 |
2,051 |
2,220 |
|
Fianna Fáil |
Ted Fitzgerald* |
7.23 |
1,391 |
1,407 |
1,414 |
1,436 |
1,479 |
1,622 |
1,752 |
1,857 |
2,034 |
|
Fine Gael |
Pat McCarthy |
7.19 |
1,384 |
1,394 |
1,403 |
1,453 |
1,646 |
1,687 |
1,755 |
1,835 |
2,013 |
|
Independent |
Billy Leen* |
6.49 |
1,249 |
1,272 |
1,303 |
1,369 |
1,402 |
1,443 |
1,495 |
1,680 |
1,835 |
|
Fianna Fáil |
Charlie Farrelly |
4.54 |
873 |
875 |
877 |
889 |
897 |
925 |
|
|
|
|
Labour Party |
Donal Tobin |
4.44 |
854 |
865 |
877 |
988 |
1,063 |
1,187 |
1,214 |
1,390 |
|
|
Independent |
Tommy Foley |
4.03 |
776 |
809 |
834 |
888 |
915 |
989 |
1,000 |
|
|
|
Fianna Fáil |
Johnnie Wall |
3.85 |
742 |
761 |
772 |
807 |
829 |
|
|
|
|
|
Fine Gael |
John Shanahan |
3.27 |
630 |
630 |
631 |
660 |
|
|
|
|
|
|
Green Party |
David Grey |
2.91 |
561 |
570 |
582 |
|
|
|
|
|
|
|
Sinn Féin |
Maisie Houlihan |
2.74 |
527 |
|
|
|
|
|
|
|
|
| Electorate: 32,127 Valid: 19,249 (59.92%) Spoilt: 335 Quota: 2,407 Turnout: 19,584 (60.96%) |