Influential observation
In statistics, an influential observation is an observation for a statistical calculation whose deletion from the dataset would noticeably change the result of the calculation.[1] In particular, in regression analysis an influential point is one whose deletion has a large effect on the parameter estimates.[2]
Assessment
Various methods have been proposed for measuring influence.[3][4] Assume an estimated regression , where is an n×1 column vector for the response variable, is the n×k design matrix of explanatory variables (including a constant), is the n×1 residual vector, and is a k×1 vector of estimates of some population parameter . Also define , the projection matrix of . Then we have the following measures of influence:


- , where denotes the coefficients estimated with the i-th row of deleted, denotes the i-th row of . Thus DFBETA measures the difference in each parameter estimate with and without the influential point. There is a DFBETA for each point and each observation (if there are N points and k variables there are N·k DFBETAs).[5]
- DFFITS
- Cook's D measures the effect of removing a data point on all the parameters combined.[2]


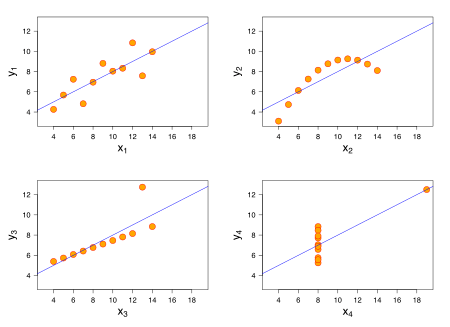
Outliers, leverage and influence
An outlier may be defined as a surprising data point. Leverage is a measure of how much the estimated value of the dependent variable changes when the point is removed. There is one value of leverage for each data point.[6] Data points with high leverage force the regression line to be close to the point.[2] In Anscombe's quartet, only the bottom right image has a point with high leverage.
See also
References
- ↑ Burt, James E.; Barber, Gerald M.; Rigby, David L. (2009), Elementary Statistics for Geographers, Guilford Press, p. 513, ISBN 9781572304840 .
- 1 2 3 Everitt, Brian (1998). The Cambridge Dictionary of Statistics. Cambridge, UK New York: Cambridge University Press. ISBN 0-521-59346-8.
- ↑ Winner, Larry (March 25, 2002). "Influence Statistics, Outliers, and Collinearity Diagnostics".
- ↑ Belsley, David A.; Kuh, Edwin; Welsh, Roy E. (1980). Regression Diagnostics: Identifying Influential Data and Sources of Collinearity. Wiley Series in Probability and Mathematical Statistics. New York: John Wiley & Sons. pp. 11–16. ISBN 0-471-05856-4.
- ↑ "Outliers and DFBETA" (PDF). Archived (PDF) from the original on May 11, 2013.
- ↑ Hurvich, Clifford. "Simple Linear Regression VI: Leverage and Influence" (PDF). NYU Stern. Archived (PDF) from the original on September 21, 2006.
Further reading
- Dehon, Catherine; Gassner, Marjorie; Verardi, Vincenzo (2009). "Beware of 'Good' Outliers and Overoptimistic Conclusions". Oxford Bulletin of Economics and Statistics. 71 (3): 437–452. doi:10.1111/j.1468-0084.2009.00543.x.
- Kennedy, Peter (2003). "Robust Estimation". A Guide to Econometrics (Fifth ed.). Cambridge: The MIT Press. pp. 372–388. ISBN 0-262-61183-X.