Hydrogen spectral series
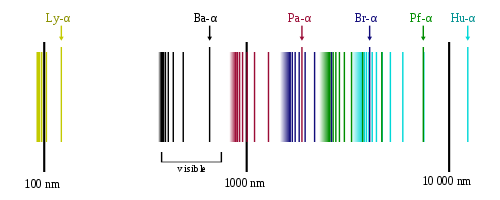
The emission spectrum of atomic hydrogen is divided into a number of spectral series, with wavelengths given by the Rydberg formula. These observed spectral lines are due to the electron making transitions between two energy levels in an atom. The classification of the series by the Rydberg formula was important in the development of quantum mechanics. The spectral series are important in astronomical spectroscopy for detecting the presence of hydrogen and calculating red shifts.
Physics
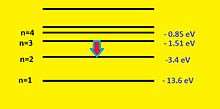
A hydrogen atom consists of an electron orbiting its nucleus. The electromagnetic force between the electron and the nuclear proton leads to a set of quantum states for the electron, each with its own energy. These states were visualized by the Bohr model of the hydrogen atom as being distinct orbits around the nucleus. Each energy state, or orbit, is designated by an integer, n as shown in the figure. The Bohr model was later replaced by quantum mechanics in which the electron occupies an atomic orbital rather than an orbit, but the allowed energy levels of the hydrogen atom remained the same as in the earlier theory.
Spectral emission occurs when an electron transitions, or jumps, from a higher energy state to a lower energy state. To distinguish the two states, the lower energy state is commonly designated as n′, and the higher energy state is designated as n. The energy of an emitted photon corresponds to the energy difference between the two states. Because the energy of each state is fixed, the energy difference between them is fixed, and the transition will always produce a photon with the same energy.
The spectral lines are grouped into series according to n′. Lines are named sequentially starting from the longest wavelength/lowest frequency of the series, using Greek letters within each series. For example, the 2 → 1 line is called "Lyman-alpha" (Ly-α), while the 7 → 3 line is called "Paschen-delta” (Pa-δ).
There are emission lines from hydrogen that fall outside of these series, such as the 21 cm line. These emission lines correspond to much rarer atomic events such as hyperfine transitions.[1] The fine structure also results in single spectral lines appearing as two or more closely grouped thinner lines, due to relativistic corrections.[2]
In quantum mechanical theory, the discrete spectrum of atomic emission was based on the Schrödinger equation, which is mainly devoted to the study of energy spectra of hydrogenlike atoms, whereas the time-dependent equivalent Heisenberg equation is convenient when studying an atom driven by an external electromagnetic wave[3].
In the processes of absorption or emission of photons by an atom, the conservation laws hold for the whole isolated system, such as an atom plus a photon. Therefore the motion of the electron in the process of photon absorption or emission is always accompanied by motion of the nucleus, and, because the mass of the nucleus is always finite, the energy spectra of hydrogenlike atoms must depend on the nuclear mass. And since hydrogen atoms have a nucleus of only one proton, the spectrum energy of an hydrogen atom depends only by the nucleus (e.g. in the Coulomb field): in fact, the mass of one proton is ca
times the mass of an electron, which gives only the zero order of approximation and thus may be not taken into account.[3]

Rydberg formula
The energy differences between levels in the Bohr model, and hence the wavelengths of emitted/absorbed photons, is given by the Rydberg formula:[4]

where Z is the atomic number, i.e. the number of protons in the atomic nucleus of this element; n is the upper energy level; n′ is the lower energy level; and R is the Rydberg constant (1.09737×10⁷ m−1).[5] Meaningful values are returned only when n is greater than n′. Note that this equation is valid for all hydrogen-like species, i.e. atoms having only a single electron, and the particular case of hydrogen spectral lines are given by Z=1.
Series
Lyman series (n′ = 1)
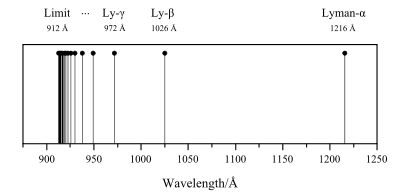
The series is named after its discoverer, Theodore Lyman, who discovered the spectral lines from 1906–1914. All the wavelengths in the Lyman series are in the ultraviolet band.[6][7]
| n | λ, vacuum
(nm) |
|---|---|
| 2 | 121.57 |
| 3 | 102.57 |
| 4 | 97.254 |
| 5 | 94.974 |
| 6 | 93.780 |
| ∞ | 91.175 |
Balmer series (n′ = 2)

Named after Johann Balmer, who discovered the Balmer formula, an empirical equation to predict the Balmer series, in 1885. Balmer lines are historically referred to as "H-alpha", "H-beta", "H-gamma" and so on, where H is the element hydrogen.[9] Four of the Balmer lines are in the technically "visible" part of the spectrum, with wavelengths longer than 400 nm and shorter than 700 nm. Parts of the Balmer series can be seen in the solar spectrum. H-alpha is an important line used in astronomy to detect the presence of hydrogen.
| n | λ, air
(nm) |
|---|---|
| 3 | 656.3 |
| 4 | 486.1 |
| 5 | 434.0 |
| 6 | 410.2 |
| 7 | 397.0 |
| ∞ | 364.6 |
Paschen series (Bohr series, n′ = 3)
Named after the German physicist Friedrich Paschen who first observed them in 1908. The Paschen lines all lie in the infrared band.[10] This series overlaps with the next (Brackett) series, i.e. the shortest line in the Brackett series has a wavelength that falls among the Paschen series. All subsequent series overlap.
| n | λ, air
(nm) |
|---|---|
| 4 | 1875 |
| 5 | 1282 |
| 6 | 1094 |
| 7 | 1005 |
| 8 | 954.6 |
| ∞ | 820.4 |
----IR region
Brackett series (n′ = 4)
Named after the American physicist Frederick Sumner Brackett who first observed the spectral lines in 1922.[11]
| n | λ, air
(nm) |
|---|---|
| 5 | 4051 |
| 6 | 2625 |
| 7 | 2166 |
| 8 | 1944 |
| 9 | 1817 |
| ∞ | 1458 |
Pfund series (n′ = 5)
Experimentally discovered in 1924 by August Herman Pfund.[12]
| n | λ, vacuum
(nm) |
|---|---|
| 6 | 7460 |
| 7 | 4654 |
| 8 | 3741 |
| 9 | 3297 |
| 10 | 3039 |
| ∞ | 2279 |
Humphreys series (n′ = 6)
Discovered in 1953 by American physicist Curtis J. Humphreys.[14]
| n | λ, vacuum
(μm) |
|---|---|
| 7 | 12.37 |
| 8 | 7.503 |
| 9 | 5.908 |
| 10 | 5.129 |
| 11 | 4.673 |
| ∞ | 3.282 |
Further (n′ > 6)
Further series are unnamed, but follow the same pattern as dictated by the Rydberg equation. Series are increasingly spread out and occur in increasing wavelengths. The lines are also increasingly faint, corresponding to increasingly rare atomic events. The seventh series of atomic hydrogen was first demonstrated experimentally at infrared wavelengths in 1972 by John Strong and Peter Hansen at the University of Massachusetts Amherst.
Extension to other systems
The concepts of the Rydberg formula can be applied to any system with a single particle orbiting a nucleus, for example a He+ ion or a muonium exotic atom. The equation must be modified based on the system's Bohr radius; emissions will be of a similar character but at a different range of energies. The Pickering-Fowler series was originally attributed to an unknown form of hydrogen with half-integer transition levels by both Pickering[15][16][17] and Fowler,[18] but Bohr correctly recognised them as spectral lines arising from the He+ nucleus.[19][20][21]
All other atoms possess at least two electrons in their neutral form and the interactions between these electrons makes analysis of the spectrum by such simple methods as described here impractical. The deduction of the Rydberg formula was a major step in physics, but it was long before an extension to the spectra of other elements could be accomplished.
See also
References
- ↑ "The Hydrogen 21-cm Line". Hyperphysics. Georgia State University. 2005-10-30. Retrieved 2009-03-18.
- ↑ Liboff, Richard L. (2002). Introductory Quantum Mechanics. Addison-Wesley. ISBN 0-8053-8714-5.
- 1 2 Andrew, A. V. (2006). "2. Schrödinger equation". Atomic spectroscopy. Introduction of theory to Hyperfine Structure. p. 274. ISBN 978-0-387-25573-6.
- ↑ Bohr, Niels (1985), "Rydberg's discovery of the spectral laws", in Kalckar, J., N. Bohr: Collected Works, 10, Amsterdam: North-Holland Publ., pp. 373–9
- ↑ "CODATA Recommended Values of the Fundamental Physical Constants: 2006" (PDF). Committee on Data for Science and Technology (CODATA). NIST.
- ↑ Lyman, Theodore (1906), "The Spectrum of Hydrogen in the Region of Extremely Short Wave-Length", Memoirs of the American Academy of Arts and Sciences, New Series, 13 (3): 125–146, ISSN 0096-6134, JSTOR 25058084
- ↑ Lyman, Theodore (1914), "An Extension of the Spectrum in the Extreme Ultra-Violet", Nature, 93: 241, Bibcode:1914Natur..93..241L, doi:10.1038/093241a0
- 1 2 3 4 Wiese, W. L.; Fuhr, J. R. (2009). "Accurate Atomic Transition Probabilities for Hydrogen, Helium, and Lithium". Journal of Physical and Chemical Reference Data. 38 (3): 565. Bibcode:2009JPCRD..38..565W. doi:10.1063/1.3077727.
- ↑ Balmer, J. J. (1885), "Notiz uber die Spectrallinien des Wasserstoffs", Annalen der Physik, 261 (5): 80–87, Bibcode:1885AnP...261...80B, doi:10.1002/andp.18852610506
- ↑ Paschen, Friedrich (1908), "Zur Kenntnis ultraroter Linienspektra. I. (Normalwellenlängen bis 27000 Å.-E.)", Annalen der Physik, 332 (13): 537–570, Bibcode:1908AnP...332..537P, doi:10.1002/andp.19083321303
- ↑ Brackett, Frederick Sumner (1922), "Visible and Infra-Red Radiation of Hydrogen", Astrophysical Journal, 56: 154, Bibcode:1922ApJ....56..154B, doi:10.1086/142697
- ↑ Pfund, A. H. (1924), "The emission of nitrogen and hydrogen in infrared", J. Opt. Soc. Am., 9 (3): 193–196, doi:10.1364/JOSA.9.000193
- 1 2 Kramida, A. E.; et al. (November 2010). "A critical compilation of experimental data on spectral lines and energy levels of hydrogen, deuterium, and tritium". Atomic Data and Nuclear Data Tables. 96 (6): 586–644. Bibcode:2010ADNDT..96..586K. doi:10.1016/j.adt.2010.05.001.
- ↑ Humphreys, C.J. (1953), "The Sixth Series in the Spectrum of Atomic Hydrogen", J. Research Natl. Bur. Standards, 50
- ↑ Pickering, E. C. (1896). "Stars having peculiar spectra. New variable stars in Crux and Cygnus" (PDF). Harvard College Observatory. 12: 1–2. Also published as: Pickering, E. C.; Fleming, W. P. (1896). "Stars having peculiar spectra. New variable stars in Crux and Cygnus". Astrophysical Journal. 4: 369–370. Bibcode:1896ApJ.....4..369P. doi:10.1086/140291.
- ↑ Pickering, E. C. (1897). "Stars having peculiar spectra. New variable Stars in Crux and Cygnus". Astronomische Nachrichten. 142 (6): 87–90. Bibcode:1896AN....142...87P. doi:10.1002/asna.18971420605.
- ↑ Pickering, E. C. (1897). "The spectrum of zeta Puppis" (PDF). Astrophysical Journal. 5: 92–94. Bibcode:1897ApJ.....5...92P. doi:10.1086/140312.
- ↑ Fowler, A. (1912). "Observations of the Principal and other Series of Lines in the Spectrum of Hydrogen". Monthly Notices of the Royal Astronomical Society. 73 (2): 62–63. Bibcode:1912MNRAS..73...62F. doi:10.1093/mnras/73.2.62.
- ↑ Bohr, N. (1913). "The Spectra of Helium and Hydrogen". Nature. 92: 231–232. Bibcode:1913Natur..92..231B. doi:10.1038/092231d0.
- ↑ Hoyer, Ulrich (1981). "Constitution of Atoms and Molecules". In Hoyer, Ulrich. Niels Bohr – Collected Works: Volume 2 – Work on Atomic Physics (1912-1917). Amsterdam: North Holland Publishing Company. pp. 103-316 (esp. pp. 116-122). ISBN 0720418003.
- ↑ Robotti, Nadia (1983). "The Spectrum of ζ Puppis and the Historical Evolution of Empirical Data". Historical Studies in the Physical Sciences. 14 (1): 123–145. doi:10.2307/27757527.
External links
| Wikimedia Commons has media related to Hydrogen spectral series. |