Hodograph
A hodograph is a diagram that gives a vectorial visual representation of the movement of a body or a fluid. It is the locus of one end of a variable vector, with the other end fixed.[1] The position of any plotted data on such a diagram is proportional to the velocity of the moving particle. It is also called a velocity diagram. It appears to have been used by James Bradley, but its practical development is mainly from Sir William Rowan Hamilton, who published an account of it in the Proceedings of the Royal Irish Academy in 1846.
Applications
It is used in physics, astronomy and fluid mechanics to plot deformation of material, motion of planet or any other data that involves the velocities of different parts of a body.
Meteorology
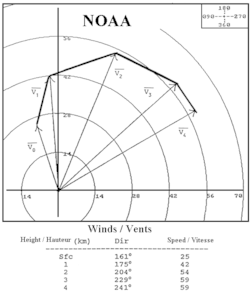
In meteorology, hodographs are used to plot winds from soundings of the Earth's atmosphere. It is a polar diagram where wind direction is indicated by the angle from the center axis and its strength by the distance from the center. In the figure to the right, at the bottom one finds values of wind at 4 heights above ground. They are plotted by the vectors to . One has to notice that direction are plotted as mentioned in the upper right corner.


With the hodograph and thermodynamic diagrams like the tephigram, meteorologists can calculate:
- Wind shear: The lines uniting the extremities of successive vectors represent the variation in direction and value of the wind in a layer of the atmosphere. Wind shear is important information in the development of thunderstorms and future evolution of wind at these levels.
- Turbulence: wind shear indicate the possible turbulence that would cause a hazard to aviation.
- Temperature advection: change of temperature in a layer of air can be calculated by the direction of the wind at that level and the direction of the wind shear with the next level. In the northern hemisphere, warm air is to the right of a wind shear between levels in the atmosphere. The opposite is true in the southern one (see thermal wind). So in the example hodograph, the wind from southwest meet the right side of the wind shear which means a warm advection and thus warming of the air at that level.

Hodograph transformation
Hodograph transformation is a technique used to transform nonlinear partial differential equations into linear version. It consists of interchanging the dependent and independent variables in the equation to achieve linearity.[2]
Further reading
- In his book Matter and Motion, Maxwell writes:
The study of the hodograph, as a method of investigating the motion of a body, was introduced by Sir W. R. Hamilton. The hodograph may be defined as the path traced out by the extremity of a vector which continually represents, in direction and magnitude, the velocity of a moving body. In applying the method of the hodograph to a planet, the orbit of which is in one plane, we shall find it convenient to suppose the hodograph turned round its origin through a right angle, so that the vector of the hodograph is perpendicular instead of parallel to the velocity it represents.
- and he applies these techniques to analyse Kepler's first and second laws.
- Free "Matter and Motion" e-books are available on the Internet.
- Feynman's Lost Lecture: The Motion of Planets Around the Sun by David L. Goodstein & Judith R. Goodstein ( ISBN 0-393-03918-8, W.W.Norton & Company: New York, 1996). In this book the hodograph is used to geometrically derive elliptical (Keplerian) orbits from Newton's laws of motion and gravitation.
See also
- Visual calculus, a related approach useful in solving a variety of integral calculus problems.
- Laplace–Runge–Lenz vector, for an example in solving the Kepler problem
References
- ↑ "AMS Glossary of Meteorology : Hodograph". Archived from the original on 2007-08-17. Retrieved 2007-05-30.
- ↑ Courant, R.; Friedrichs, K. O. (1948). Supersonic Flow and Shock Waves. Springer.
Further reading
- Hamilton, William Rowan . "The Hodograph, or a New Method of Expressing in Symbolic Language the Newtonian Law of Attraction", Proceedings of the Royal Irish Academy, Vol. 3 (1847), pp. 344–353. Edited by David R. Wilkins (2000).
External links
- The Hodograph - Dr. James B. Calvert, University of Denver