History of spectroscopy
The history of spectroscopy began in the 17th century. New designs in optics, specifically prisms, enabled systematic observations of the solar spectrum. Isaac Newton first applied the word spectrum to describe the rainbow of colors that combine to form white light. During the early 1800s, Joseph von Fraunhofer conducted experiments with dispersive spectrometers that enabled spectroscopy to become a more precise and quantitative scientific technique. Since then, spectroscopy has played and continues to play a significant role in chemistry, physics and astronomy.
Origins and experimental development
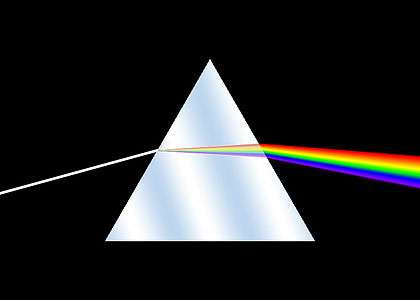
The Romans were already familiar with the ability of a prism to generate a rainbow of colors.[1] Newton is traditionally regarded as the founder of spectroscopy, but he was not the first man of science who studied and reported on the solar spectrum. The works of Athanasius Kircher (1646), Jan Marek Marci (1648), Robert Boyle (1664), and Francesco Maria Grimaldi (1665), predate Newton's optics experiments (1666–1672).[2] Newton published his experiments and theoretical explanations of dispersion of light in his 'Opticks'. His experiments demonstrated that white light could be split up into component colors by means of a prism and that these components could be recombined to generate white light. He demonstrated that the prism is not imparting or creating the colors but rather separating constituent parts of the white light.[3] Newton's corpuscular theory of light was gradually succeeded by the wave theory. It was not until the 19th century that the quantitative measurement of dispersed light was recognized and standardized. As with many subsequent spectroscopy experiments, Newton's sources of white light included flames and stars, including our own sun. Subsequent experiments with prisms provided the first indications that spectra were associated uniquely with chemical constituents. Scientists observed the emission of distinct patterns of colour when salts were added to alcohol flames.[4]
Early 19th Century (1800 - 1829)
In 1802, William Hyde Wollaston built a spectrometer, improving on Newton's model, that included a lens to focus the Sun’s spectrum on a screen. Upon use, Wollaston realized that the colors were not spread uniformly, but instead had missing patches of colors, which appeared as dark bands in the sun's spectrum.[5] At the time, Wollaston believed these lines to be natural boundaries between the colors, but this hypothesis was later ruled out in 1815 by Fraunhofer's work.[6]
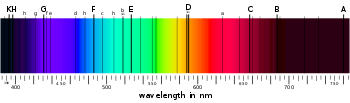
Joseph von Fraunhofer made a significant experimental leap forward by replacing a prism with a diffraction grating as the source of wavelength dispersion. Fraunhofer built off the theories of light interference developed by Thomas Young, François Arago and Augustin-Jean Fresnel. He conducted his own experiments to demonstrate the effect of passing light through a single rectangular slit, two slits, and so forth, eventually developing a means of closely spacing thousands of slits to form a diffraction grating. The interference achieved by a diffraction grating both improves the spectral resolution over a prism and allows for the dispersed wavelengths to be quantified. Fraunhofer's establishment of a quantified wavelength scale paved the way for matching spectra observed in multiple laboratories, from multiple sources (flames and the sun) and with different instruments. Fraunhofer made and published systematic observations of the solar spectrum, and the dark bands he observed and specified the wavelengths of are still known as Fraunhofer lines.[7]
Throughout the early 1800s, a number of scientists pushed the techniques and understanding of spectroscopy forward.[5] [8] In the 1820s both John Herschel and William H. F. Talbot made systematic observations of salts using flame spectroscopy.[9]
Mid 19th Century (1830 - 1869)
In 1835, Charles Wheatstone reported that different metals could be easily distinguished by the different bright lines in the emission spectra of their sparks, thereby introducing an alternative mechanism to flame spectroscopy.[10] In 1849, J. B. L. Foucault experimentally demonstrated that absorption and emission lines appearing at the same wavelength are both due to the same material, with the difference between the two originating from the temperature of the light source.[11] In 1853, the Swedish physicist Anders Jonas Ångström presented observations and theories about gas spectra in his work: Optiska Undersökningar to the Royal Swedish Academy of Sciences. Ångström postulated that an incandescent gas emits luminous rays of the same wavelength as those it can absorb. Ångström was unaware of Foucalt's experimental results. At the same time George Stokes and William Thomson (Kelvin) were discussing similar postulates.[11] Ångström also measured the emission spectrum from hydrogen later labeled the Balmer lines.[12] In 1854 and 1855, David Alter published observations on the spectra of metals and gases, including an independent observation of the Balmer lines of hydrogen.[13]
The systematic attribution of spectra to chemical elements began in the 1860s with the work of German physicist Gustav Kirchhoff and chemist Robert Bunsen. Bunsen and Kirchhoff applied the optical techniques of Fraunhofer, Bunsen's improved flame source and a highly systematic experimental procedure to a detailed examination of the spectra of chemical compounds. They established the linkage between chemical elements and their unique spectral patterns. In the process, they established the technique of analytical spectroscopy. In 1860, they published their findings on the spectra of eight elements and identified these elements' presence in several natural compounds.[14] [15] They demonstrated that spectroscopy could be used for trace chemical analysis and several of the chemical elements they discovered were previously unknown. Kirchhoff and Bunsen also definitively established the link between absorption and emission lines, including attributing solar absorption lines to particular elements based on their corresponding spectra.[16] Kirchhoff went on to contribute fundamental research on the nature of spectral absorption and emission, including what is now known as Kirchhoff's Law of Thermal Radiation. Kirchhoff's applications of this law to spectroscopy are captured in three laws of spectroscopy:
- An incandescent solid, liquid or gas under high pressure emits a continuous spectrum.
- A hot gas under low pressure emits a "bright-line" or emission-line spectrum.
- A continuous spectrum source viewed through a cool, low-density gas produces an absorption-line spectrum.
In the 1860s the husband-and-wife team of William and Margaret Huggins used spectroscopy to determine that the stars were composed of the same elements as found on earth. They also used the non-relativistic Doppler shift (redshift) equation on the spectrum of the star Sirius in 1868 to determine its axial speed.[17] They were the first to take a spectrum of a planetary nebula when the Cat's Eye Nebula (NGC 6543) was analyzed.[18] Using spectral techniques, they were able to distinguish nebulae from galaxies.
Late 19th Century (1870 - 1899)
Johann Balmer discovered in 1885 that the four visible lines of hydrogen were part of a series that could be expressed in terms of integers. This was followed a few years later by the Rydberg formula, which described additional series of lines.
Meanwhile, the substantial summary of past experiments performed by Maxwell (1873), resulted in his equations of electromagnetic waves.
In 1895, the German physicist Wilhelm Conrad Röntgen discovered and extensively studied X-rays, which were later used in X-ray spectroscopy. One year later, in 1896, French physicist Antoine Henri Becquerel discovered radioactivity, and Dutch physicist Pieter Zeeman observed spectral lines being split by a magnetic field.[5]
Early 20th century (1900-1950)
In 1913, Niels Bohr discovered the emission of spectral lines by observing electrons transitioning from different energy states within an atom. August Beer then observed a relationship between light absorption and concentration and created the color comparator which was later replaced by a more accurate device called the spectrophotometer.[19] In 1937 "E. Lehrer created the first fully-automated spectrometer" to help more accurately measure spectral lines.[20] With the development of more advanced instruments such as photo-detectors scientists were then able to more accurately measure specific wavelength absorption of substances.[19]
Development of quantum mechanics
In the early twentieth century, spectroscopy research contributed significantly to the development of quantum mechanics. Quantum mechanics provided an explanation of and theoretical framework for understanding spectroscopic observations.
Infrared and Raman spectroscopy
Many early scientists who studied the IR spectra of compounds had to develop and build their own instruments to be able to record their measurements making it very difficult to get accurate measurements. During World War II the U.S. government contracted different companies to develop a method for the polymerization of butadiene to create rubber, but this could only be done through analysis of Ca hydrocarbon isomers. These contracted companies started developing optical instruments and eventually created the first infrared spectrometers. With the development of these commercial spectrometers Infrared Spectroscopy became a more popular method to determine the "fingerprint" for any molecule. [19] Raman spectroscopy was first observed in 1928 by Sir Chandrasekhara Venkata Raman in liquid substances and also by "Grigory Landsberg and Leonid Mandelstam in crystals".[20] Raman spectroscopy is based on the observation of the raman effect which is defined as "The intensity of the scattered light is dependent on the amount of the polarization potential change".[20] The raman spectrum records light intensity vs. light frequency (wavenumber) and the wavenumber shift is characteristic to each individual compound.[20]
Laser spectroscopy
Laser spectroscopy is a spectroscopic technique that uses lasers to be able determine the emitted frequencies of matter.[21] The laser was invented because spectroscopists took the concept of its predecessor, the maser, and applied it to the visible and infrared ranges of light.[21] The maser was invented by Charles Townes and other spectroscopists to stimulate matter to determine the radiative frequencies that specific atoms and molecules emitted.[21] While working on the maser, Townes realized that more accurate detections were possible as the frequency of the microwave emitted increased.[21] This led to an idea a few years later to use the visible and eventually the infrared ranges of light for spectroscopy that became a reality with the help of Arthur Schawlow.[21] Since then, lasers have gone on to significantly advance experimental spectroscopy. The laser light allowed for much higher precision experiments specifically in the uses of studying collisional effects of light as well as being able to accurately detect specific wavelengths and frequencies of light, allowing for the invention of devices such as laser atomic clocks. Lasers also made spectroscopy that used time methods more accurate by using speeds or decay times of photons at specific wavelengths and frequencies to keep time.[22] Laser spectroscopic techniques have been used for many different applications. One example is using laser spectroscopy to detect compounds in materials. One specific method is called Laser-induced Fluorescence Spectroscopy, and uses spectroscopic methods to be able to detect what materials are in a solid, liquid, or gas, in situ. This allows for direct testing of materials, instead of having to take the material to a lab to figure out what the solid, liquid, or gas is made of.[23]
See also
References
- ↑ Brand, John C. D. (1995). Lines of Light: The Sources of Dispersive Spectroscopy, 1800 - 1930. Gordon and Breach Publishers. p. 57. ISBN 2884491627.
- ↑ Burns, Thorburn (1987). "Aspects of the development of colorimetric analysis and quantitative molecular spectroscopy in the ultraviolet-visible region". In Burgess, C.; Mielenz, K. D. Advances in Standards and Methodology in Spectrophotometry. Burlington: Elsevier Science. p. 1. ISBN 9780444599056.
- ↑ "The Era of Classical Spectroscopy". Retrieved 24 November 2012.
- ↑ Brand, p. 58
- 1 2 3 "A Timeline of Atomic Spectroscopy". Retrieved 24 November 2012.
- ↑ OpenStax Astronomy, "Spectroscopy in Astronomy". OpenStax CNX. Sep 29, 2016 http://cnx.org/contents/1f92a120-370a-4547-b14e-a3df3ce6f083@3

- ↑ Brand, pp. 37-42
- ↑ George Gore (1878). The Art of Scientific Discovery: Or, The General Conditions and Methods of Research in Physics and Chemistry. Longmans, Green, and Co. p. 179.
- ↑ Brand, p. 59
- ↑ Brian Bowers (2001). Sir Charles Wheatstone FRS: 1802-1875 (2nd ed.). IET. pp. 207–208. ISBN 978-0-85296-103-2.
- 1 2 Brand, pp. 60-62
- ↑ Wagner, H. J. (2005). "Early Spectroscopy and the Balmer Lines of Hydrogen". Journal of Chemical Education. 82 (3): 380. Bibcode:2005JChEd..82..380W. doi:10.1021/ed082p380.1. Retrieved 24 November 2012.
- ↑ Retcofsky, H. L. (2003). "Spectrum Analysis Discoverer?". Journal of Chemical Education. 80 (9): 1003. Bibcode:2003JChEd..80.1003R. doi:10.1021/ed080p1003.1. Retrieved 24 November 2012.
- ↑ Kirchhoff, G.; Bunsen, R. (1860). "Chemische Analyse durch Spectralbeobachtungen". Annalen der Physik. 180 (6): 161–189. Bibcode:1860AnP...186..161K. doi:10.1002/andp.18601860602. Retrieved 24 November 2012.
- ↑ Kirchhoff, G.; Bunsen, R. (1901). "Chemical Analysis By Spectral Observations". In Brace, D. B. The Laws of Radiation and Absorption: Memoirs by Prévost, Stewart, Kirchhoff, and Kirchhoff and Bunsen. New York: American Book Company. pp. 99–125.
- ↑ Brand, pp. 63-64
- ↑ Singh, Simon (2005). Big Bang. Harper Collins. pp. 238–246. ISBN 9780007162215.
- ↑ Kwok, Sun (2000). "Chapter 1: History and overview". The Origin and Evolution of Planetary Nebulae. Cambridge University Press. pp. 1–7. ISBN 0-521-62313-8.
- 1 2 3 Thomas, Nicholas C. (1991-08-01). "The early history of spectroscopy". Journal of Chemical Education. 68 (8): 631. Bibcode:1991JChEd..68..631T. doi:10.1021/ed068p631. ISSN 0021-9584.
- 1 2 3 4 "Infrared and Raman spectroscopy". Mineral Physics. Retrieved 2018-04-05.
- 1 2 3 4 5 "December 1958: Invention of the Laser". Retrieved 2018-04-29.
- ↑ "MIT Spectroscopy Lab - History". web.mit.edu. Retrieved 2018-03-23.
- ↑ Fiddler, Marc N.; Begashaw, Israel; Mickens, Matthew A.; Collingwood, Michael S.; Assefa, Zerihun; Bililign, Solomon (2009-12-22). "Laser Spectroscopy for Atmospheric and Environmental Sensing". Sensors (Basel, Switzerland). 9 (12): 10447–10512. doi:10.3390/s91210447. PMC 3267232. PMID 22303184.