History of Guatemalan migrants in the United States
Guatemalan migrants are the 10th largest migrant group in the United States.,[1] and the 3rd largest immigrant group from Central America.[2] The 2015 American Community Survey estimates the Guatemalan American migrant population at 1,300,000, which is roughly 3% of the US foreign born population, and 0.4% of the total population of the United States.[3] Of this group, the majority live in California, New York, Florida, and Texas. Roughly one quarter of Guatemalan Migrants reside in Anaheim County, California alone.[2] A majority of these migrants are men; according to 2015 American Community Survey, roughly 57% of all Guatemalan Migrants are male.[4] They also tend to be younger, with 86% falling between the ages of 18 and 65. In comparison, approximately 60% of the native born population and 80% of the foreign born population are in the same age range.[2] Of the 650,000 (62.5%) Guatemalan migrants in the labor market, approximately one third are employed in the service sector.[5]
Migration trends

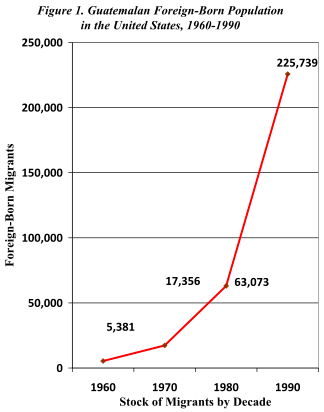
Guatemalan migration predominantly began in the 1960s. This decade is historically important to migration, being that the U.S. had just transitioned into its expansionary period. The U.S. had enacted the Hart-Cellar Act in 1965 which established a new 20,000 migrant limit per-country with preference to family reunification. In 1990 the United States amended the Immigration Act, raising the number of admitted legal permanent residents from 500,000 to 700,000. This also meant that U.S. would no longer discriminate against countries of origin in regards to granting visas. In Figure 1, we see a steady increase in the Guatemalan foreign-born stock population in the U.S. between the decades of 1960-1990. This increase is understandable given the current progressive immigration law in the U.S. at the time and the fact that during 1960 and 1996 the Guatemalan Civil War was erupting.
Guatemalan Civil War
The intensification of the Guatemalan Civil War during the 1970s and 1980s led to an influx of tens of thousands of Guatemalan refugees into the United States via Mexico, via both legal and illegal means. Guatemalan refugees became an important political and economic influence on seeking an end to the civil war, which finally came about in 1996. They also organized to change policies of the Mexican government in dealing with Guatemalan immigrants' legal status, their experience in Mexico, and difficulties of Guatemalans in Mexico immigrating to the US.
During the Guatemalan civil war, there was massive destruction of rural villages and farmlands. In the 1996 peace accords, there was a free exchange of civilian land to favor the rise of corporate agribusinesses with the drop of prices of local agricultural products. This heavily affected farm workers and inhabitants of the countryside and they had to immigrate into the US through Mexican territory.
The peak statistic of Figure 1, is the foreign-born stock migrant increase from 1980-1990. This marks the largest Guatemalan migration. Here we see that migrant numbers go from 63,073 in 1980 to 225,739 in 1990. This is likely the result of political, social, and economic unrest caused by the Guatemalan Civil War raging during this period. This change over time may be a combination of the Immigration Act of 1990, along with the civil war circumstances taking place in Guatemala, causing many migrants to flee the country.
After September 11, 2001, Mexican officials made new laws through an initiative limiting immigration visas and other repressive measures on the southern Mexican border through Plan Sur, a binational treaty with the Guatemalan government.
Migration today
The graph below shows that a majority of the granted citizenship for Guatemalans in 2016 was due in large part from family members.[7] The United States Citizenship and Immigration Services website says if you are a United States citizen, you are eligible to petition a family member to receive a Green Card (permanent residence). The petition can be for immediate family members only, such as a child, spouse or parent.[8] Here we can see that a total of 6,295 out of 13,002 individuals came based on immediate relatives of U.S. citizens. That is 48.5% of the granted total, making it one of the highest percentages for a specific broad class.
| LAWFUL PERMANENT RESIDENT STATUS BY BROAD CLASS OF ADMISSION FISCAL YEAR 2016 | |||||||
| Country of Birth | Family sponsored | Employment based | Immediate relatives of U.S. citizens | Diversity | Refugees and asylees | Other | Total |
| Guatemala | 2,438 | 1,530 | 6,295 | 13 | 1,162 | 1,564 | 13,002 |
| Percent | 18.7% | 11.7% | 48.5% | 0.1% | 9.0% | 12.0% | 100% |
Source: U.S. Department of Homeland Security [7]
References
- ↑ "Largest U.S. Immigrant Groups over Time, 1960-Present". migrationpolicy.org. 2013-10-02. Retrieved 2018-03-01.
- 1 2 3 "Central American Immigrants in the United States". migrationpolicy.org. 2017-04-04. Retrieved 2018-03-01.
- ↑ "2011-2015 American Community Survey Selected Population Tables". U.S. Census Bureau. 2015.
- ↑ "2010 Census Summary File 2: Sex By Age". U.S. Census Bureau. 2015.
- ↑ "2011-2015 American Community Survey Selected Population Tables". U.S. Census Bureau. 2015.
- ↑ Yax, Population Division, Laura K. "Historical Census Statistics on the Foreign-Born Population of the United States: 1850 to 1990". www.census.gov. Retrieved 2018-03-01.
- 1 2 "Yearbook 2016". Department of Homeland Security. 2017-05-16. Retrieved 2018-03-01.
- ↑ "Green Card for Immediate Relatives of U.S. Citizen". USCIS. Retrieved 2018-03-01.