Gettnau
| Gettnau | ||
|---|---|---|
_075.JPG) | ||
| ||
 Gettnau | ||
|
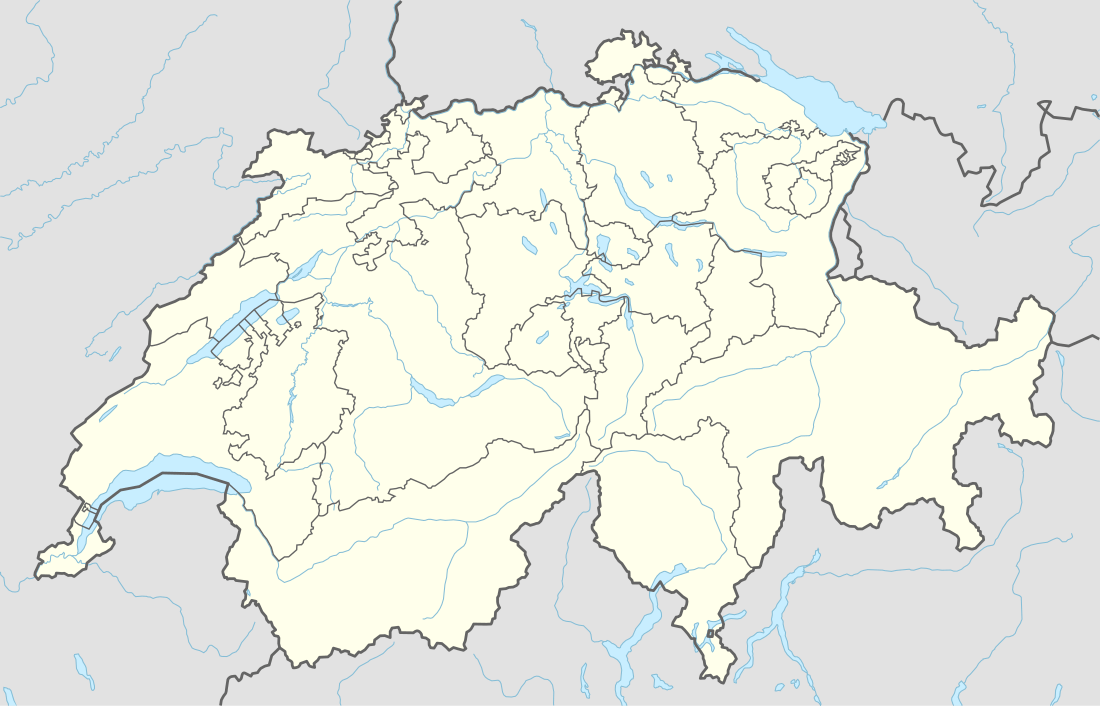
Location of Gettnau  Gettnau Gettnau (Canton of Lucerne) | ||
| Coordinates: 47°8′N 7°58′E / 47.133°N 7.967°ECoordinates: 47°8′N 7°58′E / 47.133°N 7.967°E | ||
| Country | Switzerland | |
| Canton | Lucerne | |
| District | Willisau | |
| Area[1] | ||
| • Total | 6.05 km2 (2.34 sq mi) | |
| Elevation | 548 m (1,798 ft) | |
| Population (Dec 2017[2]) | ||
| • Total | 1,151 | |
| • Density | 190/km2 (490/sq mi) | |
| Postal code | 6142 | |
| SFOS number | 1130 | |
| Surrounded by | Alberswil, Ohmstal, Schötz, Willisau, Zell | |
| Website |
www Profile (in German), SFSO statistics | |

Gettnau is a municipality in the district of Willisau in the canton of Lucerne in Switzerland.
History
Gettnau is first mentioned in the 9th Century as Kepinhouva.[3]
Geography
Gettnau had an area, (as of the 2004/09 survey) of 6.05 km2 (2.34 sq mi).[1] Of this area, about 52.5% is used for agricultural purposes, while 36.2% is forested. Of the rest of the land, 10.5% is settled (buildings or roads) and 0.8% is unproductive land. Over the past two decades (1979/85-2004/09) the amount of land that is settled has increased by 10 ha (25 acres) and the agricultural land has decreased by 9 ha (22 acres).[4]
In the 1997 land survey, 37.13% of the total land area was forested. Of the agricultural land, 50.17% is used for farming or pastures, while 2.48% is used for orchards or vine crops. Of the settled areas, 2.97% is covered with buildings, 2.15% is industrial, 0.66% is classed as special developments, and 3.96% is transportation infrastructure. Of the unproductive areas, 0.33% is unproductive flowing water (rivers) and 0.17% is other unproductive land.[5]
The municipality is located at the entrance to the Luthern valley.
Demographics
Gettnau has a population (as of December 2017) of 1,151.[2] As of 2013, 16.9% of the population are resident foreign nationals. Over the last 3 years (2010-2013) the population has changed at a rate of 1.67%. The birth rate in the municipality, in 2013, was 11.6 while the death rate was 5.8 per thousand residents.[4] Most of the population (as of 2000) speaks German (89.0%), with Albanian being second most common (5.2%) and Portuguese being third (1.4%).
As of 2013, children and teenagers (0–19 years old) make up 24.2% of the population, while adults (20–64 years old) are 61.6% and seniors (over 64 years old) make up 14.2%.[4]
In 2013 there were 392 private households in Gettnau. Of the 204 inhabited buildings in the municipality, in 2000, about 49.5% were single family homes and 14.7% were multiple family buildings. Additionally, about 26.5% of the buildings were built before 1919, while 8.8% were built between 1991 and 2000.[6] In 2012 there was no new construction and the vacancy rate for the municipality, in 2014, was 1.83%.[4] As of 2000 there are 330 households, of which 79 households (or about 23.9%) contain only a single individual. 54 or about 16.4% are large households, with at least five members.[5] As of 2000 there were 199 inhabited buildings in the municipality, of which 128 were built only as housing, and 71 were mixed use buildings. There were 99 single family homes, 15 double family homes, and 14 multi-family homes in the municipality. Most homes were either two (71) or three (41) story structures. There were only 10 single story buildings and 6 four or more story buildings.[5]
The historical population is given in the following chart:[7][3]

Economy
As of 2012, there were a total of 461 people employed in the municipality. Of these, a total of 79 people worked in 29 businesses in the primary economic sector. The secondary sector employed 252 workers in 21 separate businesses. Finally, the tertiary sector provided 130 jobs in 46 businesses. In 2013 a total of 0.% of the population received social assistance.[4]
Politics
In the 2015 federal election the most popular party was the CVP with 39.1% of the vote. The next three most popular parties were the SVP (33.9%), the FDP (21.0%) and the SP (3.1%). In the federal election, a total of 384 votes were cast, and the voter turnout was 54.9%.[8]
Religion
In the 2000 census the religious membership of Gettnau was; 794 (80.2%) were Roman Catholic, and 114 (11.5%) were Protestant, with an additional 4 (0.4%) that were of some other Christian faith. There are 17 individuals (1.72% of the population) who are Muslim. Of the rest; there were 8 (0.81%) individuals who belong to another religion (not listed), 12 (1.21%) who do not belong to any organized religion, 41 (4.14%) who did not answer the question.[5]
Education
The entire Swiss population is generally well educated. In Gettnau about 58% of the population (between age 25-64) have completed either non-mandatory upper secondary education or additional higher education (either university or a Fachhochschule).
Crime
In 2014 the crime rate, of the over 200 crimes listed in the Swiss Criminal Code (running from murder, robbery and assault to accepting bribes and election fraud), in Gettnau was 32.9 per thousand residents. This rate is only 57.0% of the cantonal rate and 50.9% of the average rate in the entire country. During the same period, the rate of drug crimes was 4.8 per thousand residents, which is only 48.5% of the national rate.[9]
References
- 1 2 Arealstatistik Standard - Gemeindedaten nach 4 Hauptbereichen
- 1 2 Swiss Federal Statistical Office - STAT-TAB, online database – Ständige und nichtständige Wohnbevölkerung nach institutionellen Gliederungen, Geburtsort und Staatsangehörigkeit (in German) accessed 17 September 2018
- 1 2 Gettnau in German, French and Italian in the online Historical Dictionary of Switzerland.
- 1 2 3 4 5 Swiss Federal Statistical Office - Regional portraits Archived January 5, 2016, at the Wayback Machine. accessed 2 May 2016
- 1 2 3 4 LUSTAT Lucerne Cantonal Statistics Archived November 27, 2011, at the Wayback Machine. (in German) accessed 12 August 2009
- ↑ Swiss Federal Statistical Office STAT-TAB - Thema 09 - Bau- und Wohnungswesen (in German) accessed 5 May 2016
- ↑ Swiss Federal Statistical Office STAT-TAB Bevölkerungsentwicklung nach institutionellen Gliederungen, 1850-2000 (in German) accessed 27 April 2016
- ↑ Swiss Federal Statistical Office - Nationalratswahlen 2015: Stärke der Parteien und Wahlbeteiligung nach Gemeinden Archived August 2, 2016, at the Wayback Machine. (in German) accessed 18 July 2016
- ↑ Statistical Atlas of Switzerland accessed 5 April 2016
| Wikimedia Commons has media related to Gettnau. |
External links
- Gettnau in German, French and Italian in the online Historical Dictionary of Switzerland.