Genotype frequency
Genetic variation in populations can be analyzed and quantified by the frequency of alleles. Two fundamental calculations are central to population genetics: allele frequencies and genotype frequencies.[1] Genotype frequency in a population is the number of individuals with a given genotype divided by the total number of individuals in the population.[2] In population genetics, the genotype frequency is the frequency or proportion (i.e., 0 < f < 1) of genotypes in a population.
Although allele and genotype frequencies are related, it is important to clearly distinguish them.
Genotype frequency may also be used in the future (for "genomic profiling") to predict someone's having a disease[3] or even a birth defect.[4] It can also be used to determine ethnic diversity.
Numerical example
As an example, let's consider a population of 100 four-o-'clock plants (Mirabilis jalapa) with the following genotypes:
- 49 red-flowered plants with the genotype AA
- 42 pink-flowered plants with genotype Aa
- 9 white-flowered plants with genotype aa
When calculating an allele frequency for a diploid species, remember that homozygous individuals have two copies of an allele, whereas heterozygotes have only one. In our example, each of the 42 pink-flowered heterozygotes has one copy of the a allele, and each of the 9 white-flowered homozygotes has two copies. Therefore, the allele frequency for a (the white color allele) equals

This result tells us that the allele frequency of a is 0.3. In other words, 30% of the alleles for this gene in the population are the a allele.
Compare genotype frequency: let's now calculate the genotype frequency of aa homozygotes (white-flowered plants).

Allele and genotype frequencies always sum to less than or equal to one (in other words, less than or equal to 100%).
The Hardy–Weinberg law describes the relationship between allele and genotype frequencies when a population is not evolving. Let's examine the Hardy–Weinberg equation using the population of four-o'clock plants that we considered above:
if the allele A frequency is denoted by the symbol p and the allele a frequency denoted by q, then p+q=1.
For example, if p=0.7, then q must be 0.3. In other words, if the allele frequency of A equals 70%, the remaining 30% of the alleles must be a, because together they equal 100%.[5]
For a gene that exists in two alleles, the Hardy–Weinberg equation states that (p2) + (2pq) + (q2) = 1
If we apply this equation to our flower color gene, then
- (genotype frequency of homozygotes)
- (genotype frequency of heterozygotes)
- (genotype frequency of homozygotes)


If p=0.7 and q=0.3, then
- = (0.7)2 = 0.49
- = 2×(0.7)×(0.3) = 0.42
- = (0.3)2 = 0.09
This result tells us that, if the allele frequency of A is 70% and the allele frequency of a is 30%, the expected genotype frequency of AA is 49%, Aa is 42%, and aa is 9%.[6]
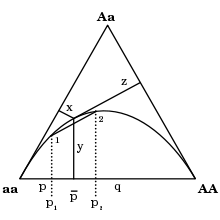
Genotype frequencies may be represented by a De Finetti diagram.
References
- ↑ Brooker R, Widmaier E, Graham L, and Stiling P. Biology (2011): p. 492
- ↑ Brooker R, Widmaier E, Graham L, and Stiling P. Biology (2011): p. G-14
- ↑ Janssens; et al. "Genomic profiling: the critical importance of genotype frequency". PHG Foundation.
- ↑ Shields; et al. "Neural Tube Defects: an Evaluation of Genetic Risk" (PDF).
- ↑ Brooker R, Widmaier E, Graham L, and Stiling P. Biology (2011): p. 492
- ↑ Brooker R, Widmaier E, Graham L, and Stiling P. Biology (2011): p. 493
Notes
- Brooker R, Widmaier E, Graham L, Stiling P (2011). Biology (2nd ed.). New York: McGraw-Hill. ISBN 978-0-07-353221-9.