Federal funds rate


In the United States, the federal funds rate is the interest rate at which depository institutions (banks and credit unions) lend reserve balances to other depository institutions overnight, on an uncollateralized basis. Reserve balances are amounts held at the Federal Reserve to maintain depository institutions' reserve requirements. Institutions with surplus balances in their accounts lend those balances to institutions in need of larger balances. The federal funds rate is an important benchmark in financial markets.[1][2]
The interest rate that the borrowing bank pays to the lending bank to borrow the funds is negotiated between the two banks, and the weighted average of this rate across all such transactions is the federal funds effective rate.
The federal funds target rate is determined by a meeting of the members of the Federal Open Market Committee which normally occurs eight times a year about seven weeks apart. The committee may also hold additional meetings and implement target rate changes outside of its normal schedule.
The Federal Reserve uses open market operations to influence the supply of money in the U.S. economy[3] to make the federal funds effective rate follow the federal funds target rate.
Mechanism
Financial Institutions are obligated by law to maintain certain levels of reserves, either as reserves with the Fed or as vault cash. The level of these reserves is determined by the outstanding assets and liabilities of each depository institution, as well as by the Fed itself, but is typically 10%[4] of the total value of the bank's demand accounts (depending on bank size). In the range of $9.3 million to $43.9 million, for transaction deposits (checking accounts, NOWs, and other deposits that can be used to make payments) the reserve requirement in 2007–2008 was 3 percent of the end-of-the-day daily average amount held over a two-week period. Transaction deposits over $43.9 million held at the same depository institution carried a 10 percent reserve requirement.
For example, assume a particular U.S. depository institution, in the normal course of business, issues a loan. This dispenses money and decreases the ratio of bank reserves to money loaned. If its reserve ratio drops below the legally required minimum, it must add to its reserves to remain compliant with Federal Reserve regulations. The bank can borrow the requisite funds from another bank that has a surplus in its account with the Fed. The interest rate that the borrowing bank pays to the lending bank to borrow the funds is negotiated between the two banks, and the weighted average of this rate across all such transactions is the federal funds effective rate.
The federal funds target rate is set by the governors of the Federal Reserve, which they enforce by open market operations and adjustments in the interest rate on reserves.[5] The target rate is almost always what is meant by the media referring to the Federal Reserve "changing interest rates." The actual federal funds rate generally lies within a range of that target rate, as the Federal Reserve cannot set an exact value through open market operations.
Another way banks can borrow funds to keep up their required reserves is by taking a loan from the Federal Reserve itself at the discount window. These loans are subject to audit by the Fed, and the discount rate is usually higher than the federal funds rate. Confusion between these two kinds of loans often leads to confusion between the federal funds rate and the discount rate. Another difference is that while the Fed cannot set an exact federal funds rate, it does set the specific discount rate.
The federal funds rate target is decided by the governors at Federal Open Market Committee (FOMC) meetings. The FOMC members will either increase, decrease, or leave the rate unchanged depending on the meeting's agenda and the economic conditions of the U.S. It is possible to infer the market expectations of the FOMC decisions at future meetings from the Chicago Board of Trade (CBOT) Fed Funds futures contracts, and these probabilities are widely reported in the financial media.
Applications
Interbank borrowing is essentially a way for banks to quickly raise money. For example, a bank may want to finance a major industrial effort but may not have the time to wait for deposits or interest (on loan payments) to come in. In such cases the bank will quickly raise this amount from other banks at an interest rate equal to or higher than the Federal funds rate.
Raising the federal funds rate will dissuade banks from taking out such inter-bank loans, which in turn will make cash that much harder to procure. Conversely, dropping the interest rates will encourage banks to borrow money and therefore invest more freely.[6] This interest rate is used as a regulatory tool to control how freely the U.S. economy operates.
By setting a higher discount rate the Federal Bank discourages banks from requisitioning funds from the Federal Bank, yet positions itself as a lender of last resort.
Comparison with LIBOR
Though the London Interbank Offered Rate (LIBOR) and the federal funds rate are concerned with the same action, i.e. interbank loans, they are distinct from one another, as follows:
- The target federal funds rate is a target interest rate that is set by the FOMC for implementing U.S. monetary policies.
- The (effective) federal funds rate is achieved through open market operations at the Domestic Trading Desk at the Federal Reserve Bank of New York which deals primarily in domestic securities (U.S. Treasury and federal agencies' securities).[7]
- LIBOR is based on a questionnaire where a selection of banks guess the rates at which they could borrow money from other banks.
- LIBOR may or may not be used to derive business terms. It is not fixed beforehand and is not meant to have macroeconomic ramifications.[8]
Predictions by the market
Considering the wide impact a change in the federal funds rate can have on the value of the dollar and the amount of lending going to new economic activity, the Federal Reserve is closely watched by the market. The prices of Option contracts on fed funds futures (traded on the Chicago Board of Trade) can be used to infer the market's expectations of future Fed policy changes. Based on CME Group 30-Day Fed Fund futures prices, which have long been used to express the market’s views on the likelihood of changes in U.S. monetary policy, the CME Group FedWatch tool allows market participants to view the probability of an upcoming Fed Rate hike. One set of such implied probabilities is published by the Cleveland Fed.
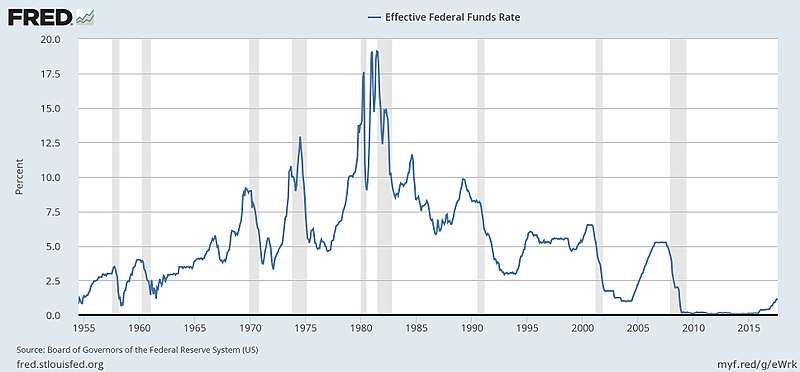
Historical rates
As of 26 September 2018 the target range for the Federal Funds Rate is 2.00–2.25%.[9] This represents the eighth increase in the target rate since tightening began in December 2015.[10]
The last full cycle of rate increases occurred between June 2004 and June 2006 as rates steadily rose from 1.00% to 5.25%. The target rate remained at 5.25% for over a year, until the Federal Reserve began lowering rates in September 2007. The last cycle of easing monetary policy through the rate was conducted from September 2007 to December 2008 as the target rate fell from 5.25% to a range of 0.00–0.25%. Between December 2008 and December 2015 the target rate remained at 0.00–0.25%, the lowest rate in the Federal Reserve's history, as a reaction to the Financial crisis of 2007–2008 and its aftermath. According to Jack A. Ablin, chief investment officer at Harris Private Bank, one reason for this unprecedented move of having a range, rather than a specific rate, was because a rate of 0% could have had problematic implications for money market funds, whose fees could then outpace yields.[11]
Explanation of federal funds rate decisions
When the Federal Open Market Committee wishes to reduce interest rates they will increase the supply of money by buying government securities. When additional supply is added and everything else remains constant, price normally falls. The price here is the interest rate (cost of money) and specifically refers to the Federal Funds Rate. Conversely, when the Committee wishes to increase the Fed Funds Rate, they will instruct the Desk Manager to sell government securities, thereby taking the money they earn on the proceeds of those sales out of circulation and reducing the money supply. When supply is taken away and everything else remains constant, price (or in this case interest rates) will normally rise.[12]
The Federal Reserve has responded to a potential slow-down by lowering the target federal funds rate during recessions and other periods of lower growth. In fact, the Committee's lowering has recently predated recessions,[13] in order to stimulate the economy and cushion the fall. Reducing the Fed Funds Rate makes money cheaper, allowing an influx of credit into the economy through all types of loans.
The charts linked below show the relation between S&P 500 and interest rates.
- July 13, 1990 — Sept 4, 1992: 8.00%–3.00% (Includes 1990–1991 recession)[14][15]
- Feb 1, 1995 — Nov 17, 1998: 6.00–4.75 [16][17][18]
- May 16, 2000 — June 25, 2003: 6.50–1.00 (Includes 2001 recession)[19][20][21]
- June 29, 2006 — (Oct. 29 2008): 5.25–1.00[22]
- Dec 16, 2008 — 0.0–0.25[23]
- Dec 16, 2015 — 0.25–0.50[24]
- Dec 14, 2016 — 0.50–0.75[25]
- Mar 15, 2017 — 0.75–1.00[26]
- Jun 14, 2017 — 1.00–1.25[27]
- Dec 13, 2017 — 1.25–1.50[28]
- Mar 21, 2018 — 1.50–1.75[29]
- Jun 13, 2018 — 1.75–2.00[30]
- Sep 26, 2018 — 2.00–2.25[31]
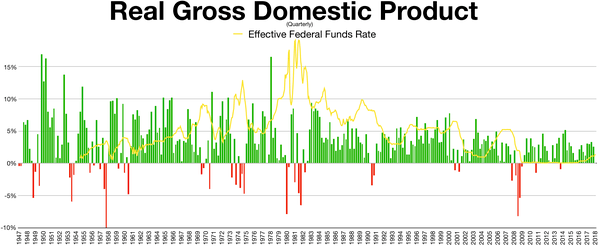
Bill Gross of PIMCO suggested that in the prior 15 years ending in 2007, in each instance where the fed funds rate was higher than the nominal GDP growth rate, assets such as stocks and housing fell.[32]
International effects
A low federal funds rate makes investments in developing countries such as China or Mexico more attractive. A high federal funds rate makes investments outside the United States less attractive. The long period of a very low federal funds rate from 2009 forward resulted in an increase in investment in developing countries. As the United States began to return to a higher rate in 2013 investments in the United States became more attractive and the rate of investment in developing countries began to fall. The rate also affects the value of currency, a higher rate increasing the value of the U.S. dollar and decreasing the value of currencies such as the Mexican peso.[33]
See also
- Austrian Business Cycle Theory
- Bank Rate
- Demand Management
- Eonia
- Equation of exchange
- Euro Interbank Offered Rate
- Federal funds probability
- Federal Reserve Economic Data
- Monetary policy
- Mortgage industry of the United States
- Official cash rate
- Official bank rate
- Real interest rate
- SARON
- SONIA
- Taylor rule
- Zero interest rate policy
References
- ↑ "Fedpoints: Federal Funds". Federal Reserve Bank of New York. August 2007. Retrieved 2 October 2011.
- ↑ "The Implementation of Monetary Policy". The Federal Reserve System: Purposes & Functions (PDF). Washington, D.C.: Federal Reserve Board. 24 August 2011. p. 4. Retrieved 2 October 2011.
- ↑ "Monetary Policy, Open Market Operations". Federal Reserve Bank. 2008-01-30. Archived from the original on 2001-04-13. Retrieved 2008-01-30.
- ↑ "Reserve Requirements". Board of Governors of The Federal Reserve System. December 16, 2015.
- ↑ Stefan Homburg (2017) A Study in Monetary Macroeconomics, Oxford University Press, ISBN 978-0-19-880753-7.
- ↑ "Fed funds rate". Bankrate, Inc. March 2016.
- ↑ Cheryl L. Edwards (November 1997). Gerard Sinzdak. "Open Market Operations in the 1990s" (PDF). Federal Reserve Bulletin (PDF).
- ↑ "BBA LIBOR - Frequently asked questions". British Bankers' Association. March 21, 2006. Archived from the original on 2007-02-16.
- ↑ "Federal Reserve issues FOMC statement" (Press release). Board of Governors of the Federal Reserve System. 2018-09-26. Retrieved 2018-09-29.
- ↑ Tankersley, Jim (2018-03-21). "Fed Raises Interest Rates for Sixth Time Since Financial Crisis". The New York Times. Retrieved 2018-03-22.
- ↑ "4:56 p.m. US-Closing Stocks". Associated Press. December 16, 2008. Archived from the original on July 18, 2012.
- ↑ David Waring (2008-02-19). "An Explanation of How The Fed Moves Interest Rates". InformedTrades.com. Archived from the original on 2015-05-05. Retrieved 2009-07-20.
- ↑ "Historical Changes of the Target Federal Funds and Discount Rates, 1971 to present". New York Federal Reserve Branch. February 19, 2010. Archived from the original on December 21, 2008.
- ↑ "$SPX 1990-06-12 1992-10-04 (rate drop chart)". StockCharts.com.
- ↑ "$SPX 1992-08-04 1995-03-01 (rate rise chart)". StockCharts.com.
- ↑ "$SPX 1995-01-01 1997-01-01 (rate drop chart)". StockCharts.com.
- ↑ "$SPX 1996-12-01 1998-10-17 (rate drop chart)". StockCharts.com.
- ↑ "$SPX 1998-09-17 2000-06-16 (rate rise chart)". StockCharts.com.
- ↑ "$SPX 2000-04-16 2002-01-01 (rate drop chart)". StockCharts.com.
- ↑ "$SPX 2002-01-01 2003-07-25 (rate drop chart)". StockCharts.com.
- ↑ "$SPX 2003-06-25 2006-06-29 (rate rise chart)". StockCharts.com.
- ↑ "$SPX 2006-06-29 2008-06-01 (rate drop chart)". StockCharts.com.
- ↑ "Press Release". Board of Governors of The Federal Reserve System. December 16, 2008.
- ↑ "Open Market Operations". Board of Governors of The Federal Reserve System. December 16, 2015.
- ↑ "Decisions Regarding Monetary Policy Implementation". Board of Governors of The Federal Reserve System. Archived from the original on 2016-12-15.
- ↑ Cox, Jeff (2017-03-15). "Fed raises rates at March meeting". CNBC. Retrieved 2017-03-15.
- ↑ "Federal Reserve issues FOMC statement". Board of Governors of The Federal Reserve System. June 14, 2017.
- ↑ "Federal Reserve issues FOMC statement". Board of Governors of The Federal Reserve System. December 13, 2017.
- ↑ "Federal Reserve issues FOMC statement". Board of Governors of The Federal Reserve System. March 21, 2018.
- ↑ "Federal Reserve issues FOMC statement". Board of Governors of The Federal Reserve System. June 13, 2018.
- ↑ "Federal Reserve issues FOMC statement". Board of Governors of The Federal Reserve System. September 26, 2018.
- ↑ Shaw, Richard (January 7, 2007). "The Bond Yield Curve as an Economic Crystal Ball". Retrieved 3 April 2011.
- ↑ Peter S. Goodman, Keith Bradsher and Neil Gough (March 16, 2017). "The Fed Acts. Workers in Mexico and Merchants in Malaysia Suffer". The New York Times. Retrieved March 18, 2017.
Rising interest rates in the United States are driving money out of many developing countries, straining governments and pinching consumers around the globe.
External links
- Historical Data: Effective Federal Funds Rate (interactive graph) from the Federal Reserve Bank of St. Louis
- Federal Reserve Web Site: Federal Funds Rate Historical Data (including the current rate), Monetary Policy, and Open Market Operations
- MoneyCafe.com page with Fed Funds Rate and historical chart and graph
- Historical chart
- Historical data (since 1954) comparing the US GDP growth rate versus the US Fed Funds Rate - in the form of a chart/graph
- Federal Reserve Bank of Cleveland: Fed Fund Rate Predictions
- Federal Funds Rate Data including Daily effective overnight rate and Target rate