Fujita scale
| F0 | 40–72 mph | Light damage |
|---|---|---|
| F1 | 73–112 mph | Moderate damage |
| F2 | 113–157 mph | Considerable damage |
| F3 | 158–206 mph | Severe damage |
| F4 | 207–260 mph | Devastating damage |
| F5 | 261–318 mph | Incredible damage |
The Fujita scale (F-Scale), or Fujita–Pearson scale (FPP scale), is a scale for rating tornado intensity, based primarily on the damage tornadoes inflict on human-built structures and vegetation. The official Fujita scale category is determined by meteorologists and engineers after a ground or aerial damage survey, or both; and depending on the circumstances, ground-swirl patterns (cycloidal marks), weather radar data, witness testimonies, media reports and damage imagery, as well as photogrammetry or videogrammetry if motion picture recording is available. The Fujita scale was replaced with the Enhanced Fujita scale (EF-Scale) in the United States in February 2007. In April 2013, Canada adopted the EF-Scale over the Fujita scale along with 31 "Specific Damage Indicators" used by Environment Canada (EC) in their ratings.[1][2]
Background
The scale was introduced in 1971 by Tetsuya Fujita of the University of Chicago, in collaboration with Allen Pearson, head of the National Severe Storms Forecast Center/NSSFC (currently the Storm Prediction Center/SPC). The scale was updated in 1973, taking into account path length and width. In the United States, starting in 1973, tornadoes were rated soon after occurrence. The Fujita scale was applied retroactively to tornadoes reported between 1950 and 1972 in the National Oceanic and Atmospheric Administration (NOAA) National Tornado Database. Fujita rated tornadoes from 1916–1992 and Tom Grazulis of The Tornado Project retroactively rated all known significant tornadoes (F2–F5 or causing a fatality) in the U.S. back to 1880.[3] The Fujita scale was adopted in most areas outside of Great Britain.
In 2007, the Fujita scale was updated, and the Enhanced Fujita Scale was introduced in the United States. The new scale more accurately matches wind speeds to the severity of damage caused by the tornado.
Though each damage level is associated with a wind speed, the Fujita scale is effectively a damage scale, and the wind speeds associated with the damage listed aren't rigorously verified. The Enhanced Fujita Scale was formulated due to research which suggested that the wind speeds required to inflict damage by intense tornadoes on the Fujita scale are greatly overestimated. A process of expert elicitation with top engineers and meteorologists resulted in the EF scale wind speeds, however, these are biased to United States construction practices. The EF scale also improved damage parameter descriptions.
Derivation
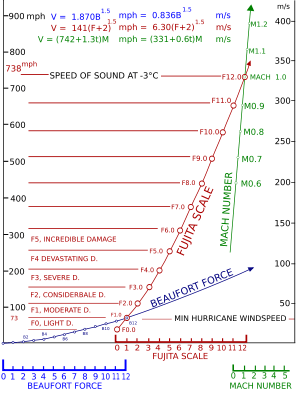
The original scale as derived by Fujita was a theoretical 13-level scale (F0–F12) designed to smoothly connect the Beaufort scale and the Mach number scale. F1 corresponds to the twelfth level of the Beaufort scale, and F12 corresponds to Mach number 1.0. F0 was placed at a position specifying no damage (approximately the eighth level of the Beaufort scale), in analogy to how the Beaufort's zeroth level specifies little to no wind. From these wind speed numbers, qualitative descriptions of damage were made for each category of the Fujita scale, and then these descriptions were used to classify tornadoes.[4] The diagram on the right illustrates the relationship between the Beaufort, Fujita, and Mach number scales.
At the time Fujita derived the scale, little information was available on damage caused by wind, so the original scale presented little more than educated guesses at wind speed ranges for specific tiers of damage. Fujita intended that only F0–F5 be used in practice, as this covered all possible levels of damage to frame homes as well as the expected estimated bounds of wind speeds. He did, however, add a description for F6, which he phrased as "inconceivable tornado", to allow for wind speeds exceeding F5 and for possible future advancements in damage analysis which might show it.[5]
Furthermore, the original wind speed numbers have since been found to be higher than the actual wind speeds required to incur the damage described at each category. The error manifests itself to an increasing degree as the category increases, especially in the range of F3 through F5. NOAA notes that "... precise wind speed numbers are actually guesses and have never been scientifically verified. Different wind speeds may cause similar-looking damage from place to place—even from building to building. Without a thorough engineering analysis of tornado damage in any event, the actual wind speeds needed to cause that damage are unknown."[5] Since then, the Enhanced Fujita Scale has been created using better wind estimates by engineers and meteorologists.
Some sources add level F+", meaning a tornado with winds below 39 mph; on rare occasions tornadoes this weak are observed covering a wide range of path widths and lengths.
Parameters
The five categories are listed here, in order of increasing intensity.
- The rating of any given tornado is of the most severe damage to any well-built frame home or comparable level of damage from engineering analysis of other damage.
- Since the Fujita scale is based on the severity of damage resulting from high winds, an F6 or an F7 tornado is a theoretical construct. Structural damage cannot exceed total destruction, which constitutes an F5. A tornado with wind speeds greater than 319 miles per hour (513 km/h) is theoretically possible, and the 1999 Bridge Creek-Moore Tornado may have been such an event. However, no such wind speed has ever been recorded and that measurement was not near ground level.
| Scale | Wind speed estimate[6] | Path width[7] | Potential damage[6] | ||
| mph | km/h | ||||
| F0 | 40–72 | 64–116 | 6–17 yards (5.5–15.5 m) | Light damage.
Some damage to chimneys; branches broken off trees; shallow-rooted trees pushed over; sign boards damaged. |
 |
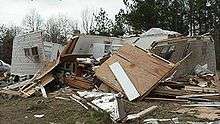
| F1 | 73–112 | 117–180 | 18–55 yards (16–50 m) | Moderate damage.
The lower limit is the beginning of hurricane wind speed; peels surface off roofs; mobile homes pushed off foundations or overturned; moving vehicles pushed off the roads; attached garages may be destroyed. |
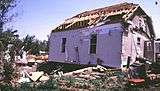 |
| F2 | 113–157 | 181–253 | 56–175 yards (51–160 m) | Significant damage.
Roofs torn off frame houses; mobile homes demolished; boxcars overturned; large trees snapped or uprooted; highrise windows broken and blown in; light-object missiles generated. |
 |
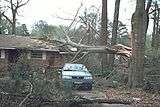
| F3 | 158–206 | 254–332 | 176–566 yards (161–518 m) | Severe damage.
Roofs and some walls torn off well-constructed houses; trains overturned; most trees in forest uprooted; heavy cars lifted off the ground and thrown. |
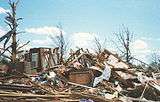 |
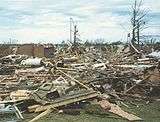
| F4 | 207–260 | 333–418 | 0.3–0.9 miles (0.48–1.45 km) | Devastating damage.
Well-constructed houses leveled; structures with weak foundations blown away some distance; cars thrown and large missiles generated. |
 |
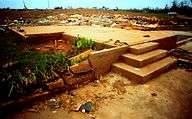
| F5 | 261–318 | 419–512 | 1.0–3.1 miles (1.6–5.0 km) | Incredible damage.
Strong frame houses lifted off foundations and carried considerable distances to disintegrate; automobile sized missiles fly through the air farther than 100 meters (110 yards); trees debarked; steel reinforced concrete structures badly damaged and skyscrapers toppled |
 |
Rating classifications
| F0 | F1 | F2 | F3 | F4 | F5 |
|---|---|---|---|---|---|
| Weak | Strong | Violent | |||
| Significant | |||||
| Intense | |||||
For purposes such as tornado climatology studies, Fujita scale ratings may be grouped into classes.[3][8][9]
Decommission in the US
The Fujita scale, introduced in 1971 as a means to differentiate tornado intensity and path area, assigned wind speeds to damage that were, at best, educated guesses.[10] Fujita and others recognized this immediately and intensive engineering analysis was conducted through the rest of the 1970s. This research, as well as subsequent research, showed that tornado wind speeds required to inflict the described damage were actually much lower than the F-scale indicated, particularly for the upper categories. Also, although the scale gave general descriptions for the type of damage a tornado could cause, it gave little leeway for strength of construction and other factors that might cause a building to receive higher damage at lower wind speeds. Fujita tried to address these problems somewhat in 1992 with the Modified Fujita Scale,[11] but by then he was semi-retired and the National Weather Service was not in a position for the undertaking of updating to an entirely new scale, so it went largely unenacted.[12]
In the United States, on February 1, 2007,[1][2] the Fujita scale was decommissioned in favor of what these scientists believe is a more accurate Enhanced Fujita Scale, which replaces it. The meteorologists and engineers who designed the EF Scale believe it an improvement on the F-scale on many counts—it accounts for different degrees of damage that occur with different types of structures, both man-made and natural. The expanded and refined damage indicators and degrees of damage standardize what was somewhat ambiguous. It also is thought to provide a much better estimate for wind speeds, and sets no upper limit on the wind speeds for the strongest level, EF5. Several countries continue to use the original Fujita Scale. Environment Canada has begun using the Enhanced Fujita scale in Canada as of April 18, 2013.[13]
See also
- List of tornadoes and tornado outbreaks
- Rohn Emergency Scale for measuring the magnitude (intensity) of any emergency
- Saffir–Simpson Hurricane Scale
- Severe weather terminology (United States)
- Tornado intensity and damage
- TORRO scale
- Wind engineering
References
Notes
- 1 2 "Fujita Tornado Damage Scale". spc.noaa.gov. Retrieved May 27, 2017.
- 1 2 "Tornado Scale – The Enhanced Fujita Scale". tornadofacts.net. Retrieved May 27, 2017.
- 1 2 Grazulis, Thomas P. (July 1993). Significant Tornadoes 1680–1991. St. Johnsbury, Vermont: The Tornado Project of Environmental Films. ISBN 1-879362-03-1.
- ↑ "Storm Prediction Center". spc.noaa.gov. Retrieved May 27, 2017.
- 1 2 Tornado FAQ. Storm Prediction Center. Site accessed June 27, 2006.
- 1 2 Fujita Tornado Damage Scale Storm Prediction Center. Accessed May 20, 2009.
- ↑ "Fujita-Pearson Tornado Scale". Stormfax. Retrieved November 20, 2017.
- ↑ The Fujita Scale of Tornado Intensity, Archived at: Archived December 30, 2011, at the Wayback Machine.
- ↑ Brooks, Harold. "index". nssl.noaa.gov. Retrieved May 27, 2017.
- ↑ Fujita, Tetsuya Theodore (1971). Proposed characterization of tornadoes and hurricanes by area and intensity. Chicago: University of Chicago.
- ↑ Center, Storm Prediction. "NOAA's NWS Storm Prediction Center". www.spc.noaa.gov. Retrieved May 27, 2017.
- ↑ Fujita, Tetsuya Theodore (1992). Memoirs of an Effort to Unlock the Mystery of Severe Storms. Chicago: University of Chicago.
- ↑ Assessing tornado damage: EF-scale vs. F-scale Archived April 27, 2013, at the Wayback Machine.
Bibliography
- Marshall, Timothy P. (2001). "Birth of the Fujita Scale". Storm Track. 24 (3): 6–10.
- Edwards, Roger; J. G. LaDue; J. T. Ferree; K. Scharfenberg; C. Maier; W. L. Coulbourne (2013). "Tornado Intensity Estimation: Past, Present, and Future". Bull. Amer. Meteor. Soc. 94 (5): 641–53. Bibcode:2013BAMS...94..641E. doi:10.1175/BAMS-D-11-00006.1.