Electropherogram
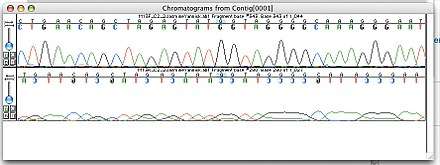
Screenshot of a chromatogram inside the program "Sequencher"

Generation of results
An electropherogram (or electrophorogram) is a record or chart produced when electrophoresis is used in an analytical technique, primarily in the fields of molecular biology or biochemistry.[1]
In the field of genetics, an electropherogram is a plot of DNA sequencing results generated by Sanger sequencing.[2] Such plots are often achieved using an instrument such as an automated DNA sequencer. Such electropherograms may be used to determine DNA sequence genotypes, or genotypes that are based on the length of specific DNA fragments. These genotypes can be used for:
See also
References
- ↑ Karabiber, F (2013). "A peak alignment algorithm with novel improvements in application to electropherogram analysis". Journal of Bioinformatics and Computational Biology. 11 (5): 1350011. doi:10.1142/S021972001350011X. PMC 4529286. PMID 24131055.
- ↑ http://www.dictionary.com/browse/electropherogram
External links
- PHPH — web-based tool for electropherogram quality analysis
- Systematic differences in electropherogram peak heights reported by different versions of the GeneScan Software
- DYS464 Electropherogram Interpretation Discrepancy with images
This article is issued from
Wikipedia.
The text is licensed under Creative Commons - Attribution - Sharealike.
Additional terms may apply for the media files.