Electrical capacitance volume tomography
Electrical Capacitance Volume Tomography (ECVT) is a non-invasive 3D imaging technology applied primarily to multiphase flows. It was first introduced by W. Warsito, Q. Marashdeh, and L.-S. Fan [1] as an extension of the conventional Electrical Capacitance Tomography (ECT). In conventional ECT, sensor plates are distributed around a surface of interest. Measured capacitance between plate combinations is used to reconstruct 2D images (tomograms) of material distribution. In ECT, the fringing field from the edges of the plates is viewed as a source of distortion to the final reconstructed image and is thus mitigated by guard electrodes. ECVT exploits this fringing field and expands it through 3D sensor designs that deliberately establish an electric field variation in all three dimensions. The image reconstruction algorithms are similar in nature to ECT; nevertheless, the reconstruction problem in ECVT is more complicated. The sensitivity matrix of an ECVT sensor is more ill-conditioned and the overall reconstruction problem is more ill-posed compared to ECT. The ECVT approach to sensor design allows direct 3D imaging of the outrounded geometry. This is different than 3D-ECT that relies on stacking images from individual ECT sensors. 3D-ECT can also be accomplished by stacking frames from a sequence of time intervals of ECT measurements. Because the ECT sensor plates are required to have lengths on the order of the domain cross-section, 3D-ECT does not provide the required resolution in the axial dimension. ECVT solves this problem by going directly to the image reconstruction and avoiding the stacking approach. This is accomplished by using a sensor that is inherently three-dimensional.
History
Electrical Capacitance Volume Tomography was first introduced by W. Warsito and L.-S. Fan in a presentation at the 3rd World Congress in Process Tomography in Banff Canada in 2003.[2] The term was coined in 2005 in a patent filed by W. Warsito, Q. Marashdeh, and L.S. Fan[3] with the emphasis on volume to distinguish the technology from earlier and ongoing development of a form called 3D-ECT where 2D tomograms are stacked on top of each other to create a pseudo 3D image. This traditional 3D-ECT approach limited the use of 3D imaging as the significant length of ECT electrodes introduced a major penalty on axial resolution of such 3D images. ECVT emerged as a solution to this limitation. ECVT provides direct 3D imaging by exploiting the X, Y, and Z components of the electric field, which are a function of sensor design. The original presentation in 2003 was followed by a publication by Q. Marashdeh and F. Teixeira in 2004 where they introduced a method to build a sensitivity matrix for these new sensors.[4][5] This new emerging form of the technology was referred to as 3D-ECT up until the filing of the patent in 2005, where it was distinguished as ECVT. A journal paper was later published, in 2007, detailing the scientific background of the technology,[1] and the chronological order of the development of ECVT was also published in a journal publication that same year.[6]
Principles
Capacitance and Field Equations in ECVT
Two metal electrodes held at different electric potential and separated by a finite distance will induce an electric field in the region between and surrounding them. The field distribution is determined by the geometry of the problem and the constitutive medium properties such as permittivity and conductivity . Assuming a static or quasi-static regime and the presence of a lossless dielectric medium, such as a perfect insulator, in the region between the plates, the field obeys the following equation:


where denotes the electric potential distribution. In a homogeneous medium with uniform , this equation reduces to the Laplace equation. In a lossy medium with finite conductivity, such as water, the field obeys the generalized Ampere equation,


By taking divergence of this equation and using the fact that , it follows:


when the plates are excited by a time-harmonic voltage potential with frequency .

The capacitance is a measure of electric energy stored in the medium, which can be quantified via the following relation:


where is the square magnitude of the electric field. The capacitance changes as a nonlinear function of the dielectric permittivity because the electric field distribution in the above integral is also a function of .

Soft-Field Tomography
Soft-field tomography refers to a set of imaging modalities such as electrical capacitance tomography (ECT), electrical impedance tomography (EIT), electrical resistivity tomography (ERT), etc., wherein electric (or magnetic) field lines undergo changes in the presence of a perturbation in the medium. This is in contrast to hard-field tomography, such as X-ray CT, where the electric field lines do not change in the presence of a test subject. A fundamental characteristic of soft-field tomography is its ill-posedness.[7] This contributes for making the reconstruction more challenging to achieve good spatial resolution in soft-field tomography as compared to hard-field tomography. A number of techniques, such Tikhonov regularization, can be used to alleviate the ill-posed problem.[8] The figure at the right shows a comparison in image resolution between ECVT and MRI.
ECVT Measurement Acquisition Systems
The hardware of ECVT systems consists of sensing electrode plates, the data acquisition circuitry, and the computer to control the overall system and process the data. ECVT is a non-intrusive and non-invasive imaging modality due to its contactless operation. Prior to the actual measurements, a calibration and normalization procedure is necessary to cancel out the effects of stray capacitance and any insulating wall between the electrodes and the region of interest to be imaged. After calibration and normalization, the measurements can be divided into a sequence of acquisitions where two separate electrodes are involved: one electrode (TX) is excited with AC voltage source in the quasi-electrostatic regime, typically below 10 MHz, while a second electrode (RX) is placed at the ground potential used for measuring the resultant current. The remaining electrodes are also placed at ground potential.
This process is repeated for all possible electrode pairs. Note that reversing the roles of TX and RX electrodes would result in the same mutual capacitance due to the reciprocity. As a result, for ECVT systems with N number of plates, the number of independent measurement is equal to N(N-1)/2. This process is typically automated through data acquisition circuitry. Depending on the operation frequency, number of plates and frame rate per second of the measurement system, one full measurement cycle can vary; however, this is in the order of few seconds or less. One of the most critical parts of ECVT systems is sensor design. As the previous discussion suggests, increasing the number of electrodes also increases the amount of independent information about the region of interests. However this results in smaller electrode sizes which in turn results in low signal to noise ratio.[9] Increasing the electrode size, on the other hand, does not result in non-uniform charge distribution over the plates, which may exacerbate the ill-posedness of the problem.[10] The sensor dimension is also limited by the gaps between the sensing electrodes. These are important due to fringe effects. The use of guard plates between electrodes have been shown to reduce these effects. Based on the intended application, ECVT sensors can be composed of single or more layers along the axial direction. The volume tomography with ECVT is not obtained from merging of 2D scans but rather from 3D discretized voxels sensitivities.
The design of the electrodes is also dictated by the shape of the domain under investigation. Some domains can be relatively simple geometries (cylindrical, rectangular prism, etc.) where symmetrical electrode placement can be used. However, complex geometries (corner joints, T-shaped domains, etc.) require specially designed electrodes to properly surround the domain. The flexibility of ECVT makes it very useful for field applications where the sensing plates cannot be placed symmetrically. It should also be noted that since the Laplace equation lacks a characteristic length (such as the wavelength in Helmholtz equation), the fundamental physics of the ECVT problem is scalable in size as long as quasi-static regime properties are preserved.
Image Reconstruction Methods for ECVT


Reconstruction methods address the inverse problem of ECVT imaging, i.e. to determine the volumetric permittivity distribution form the mutual capacitance measurements. Traditionally, the inverse problem is handled through the linearization of the (nonlinear) relationship between the capacitance and the material permittivity equation using the Born approximation. Typically, this approximation is only valid for small permittivity contrasts. For other cases, the nonlinear nature of the electric field distribution poses a challenge for both 2D and 3D image reconstruction, making the reconstruction methods an active research area for better image quality. Reconstruction methods for ECVT/ECT can be categorized as iterative and non-iterative (single step) methods.[8] The examples of non-iterative methods are linear back projection (LBP), and direct method based on singular value decomposition and Tikhonov regularization. These algorithms are computationally inexpensive; however, their tradeoff is less accurate images without quantitative information. Iterative methods can be roughly classified into projection-based and optimization-based methods. Some of the linear projection iterative algorithms used for ECVT include Newton-Raphson, Landweber iteration and steepest descent algebraic reconstruction and simultaneous reconstruction techniques, and model-based iteration. Similar to single step methods, these algorithms also use linearized sensitivity matrix for the projections to obtain the permittivity distribution inside the domain. Projection-based iterative methods typically provide better images than non-iterative algorithms yet require more computational resources. The second type of iterative reconstruction methods are optimization-based reconstruction algorithms such as neural network optimization.[12] These methods need more computational resources than the previously mentioned methods along with added complexity for the implementation. Optimization reconstruction methods employ multiple objective functions and use iterative process to minimize them. The resultant images contain less artifacts from the nonlinear nature and tend to be more reliable for quantitative applications.
Displacement-Current Phase Tomography (DCPT)
Displacement-Current Phase Tomography is an imaging modality that relies on the same hardware as ECVT.[13] ECVT does not make use of the real part (conductance component) of the obtained mutual admittance measurements. This component of the measurement is related with the material losses in the region of interest (conductivity and/or dielectric losses). DCPT utilizes the full admittance information by means of the small angle phase component of this complex valued data. DCPT can only be used when the electrodes are excited with AC voltage. It applies only to domains that include material losses, otherwise the measured phase will be zero (real part of the admittance will be zero). DCPT is designed to be used with the same reconstruction algorithms designed for ECVT. Therefore, DCPT can be used simultaneously with ECVT to image the spatial tangent loss distribution of the medium along with its spatial relative permittivity distribution from ECT.
Multi-Frequency ECVT Operation
Multiphase flows are invariably complex. Advanced measuring techniques are required to monitor and quantify phase hold ups in such multiphase flows. Due to their relatively fast speed of acquisition and non-intrusive characteristics, ECT and ECVT are widely used in industries for flow monitoring. However, the flow decomposition and monitoring capabilities of ECT/ECVT for multiphase flow containing three or more phases (e.g., a combination of oil, air, and water) is somewhat limited. Multi-frequency excitations and measurements has have been exploited and successfully used in ECT[14] image reconstruction in those cases. Multi-frequency measurements allow the exploitation of the Maxwell-Wagner-Sillars (MWS) effect on the response of the measured data (e.g., admittance, capacitance, and etc.) as a function of excitation frequency.[14] This effect was first discovered by Maxwell in 1982 [15] and later studied by Wagner and Silliars.[16][17] The MWS effect is a consequence of surface migration polarization at the interface between materials when at least one of them is conducting.[14][18][19] Typically a dielectric material presents a Debye-type [18] relaxation effect at microwave frequencies. However, due to the presence of the MWS effect (or the MWS polarization) a mixture containing at least one conducting phase will exhibit this relaxation at much lower frequencies. The MWS effect depends on several factors such as volume fraction of each phase, phase orientation, conductivity and other mixture parameters. Wagner formula[20] for dilute mixture and Bruggeman formula[21] for dense mixtures are among the most notable formulation of effective dielectric constant. Hanai’s formulation of complex dielectric constant, an extension of Bruggeman formula of effective dielectric constant, is instrumental in analyzing MWS effect for complex dielectric constant. Hanai’s formula for complex dielectric writes as


where , , and are the complex effective permittivity of the dispersed phase, continuous phase, and mixture, respectively. is the volume fraction of the dispersed phase.


Knowing that a mixture will exhibit dielectric relaxation due to the MWS effect, this additional measuring dimension can be exploited to decompose multiphase flows when at least one of the phases is conducting. The figure to the right shows the reconstructed images of the flow model, conducting phase, and non-conducting phases extracted by exploited MWS effect from experimental data.
ECVT Velocimetry

Velocimetry refers to techniques used to measure velocity of fluids. The use of the sensitivity gradient[11] enables the reconstruction of 3D velocity profiles using an ECVT sensor, which can readily provide information of fluid dynamics. The sensitivity gradient is defined as

where is the sensitivity distribution of an ECVT sensor as shown to the right. Upon application of the sensitivity gradient as described in,[11] a 3D and 2D velocity profile corresponding to the figure above are shown in the figure to the right.

The application of the sensitivity gradient provides significant improvement over more traditional (cross-correlation based) velocimetry, exhibiting better image quality and requiring less computational time. Another advantage of the sensitivity gradient based velocimetry is its compatibility with conventional image reconstruction algorithms used in ECVT.
Advantages
Modular
The basic requirements of ECVT sensors are simple and can therefore be very modular in design. ECVT sensors require only conductive electrodes which are electrically isolated from one another and are also not shorted through the medium being inspected by the ECVT sensor. Additionally there must be a way to excite and detect signal to and from each electrode. The lack of constraints on the sensor design allow it to be made out of a variety of materials and take a plethora of forms including flexible walled, high temperature performance, high pressure performance, thin walled, elbowed and flat sensors. With the addition of AECVT technology, sensor electrode configuration becomes modular as well without the need to fabricate new sensors.
Safe
ECVT is low energy, low frequency, and non-radioactive, making it safe to employ in any situation where toxic waste, high voltage, or electromagnetic radiation is a concern. The low energy nature of the technology also makes it suitable for remote locations where power is in short supply. In many occasions, a simple solar powered battery may prove sufficient enough to power an ECVT device.
Scalable
ECVT operates on very large wave lengths, typically using frequencies below 10 MHz to excite the electrodes. These long wavelengths allow the technology to operate under the quasi-electrostatic regime. As long as the diameter of the sensor is much smaller than the length of the wave, these assumptions hold valid. For instance, when exciting with 2 MHz AC signal, the wavelength is 149.9 meters. Sensor diameters are typically designed well below this limit. Additionally, capacitance strength, , scales proportionally according to electrode area, , and distance between the plates, , or the diameter of the sensor. So as a sensor diameter becomes larger, if the plate area scales accordingly, any given sensor design can easily be scaled up or down with minimal effect on the signal strength.


Low Cost & Profile
Compared to other sensing and imaging equipment such as gamma radiation, x-ray, or MRI machines, ECVT remains relatively cheap to manufacture and operate. Part of this quality of the technology is due to its low energy emissions which do not require any additional mechanisms of containing waste or insulating high power outputs. Adding to the low cost is the availability of a wide variety of materials to fabricate a sensor. Electronics can also be placed remotely from the sensor itself which allows for standard environment electronics to be utilized for data acquisition even when the sensor is subjected to extreme temperatures or other conditions which typically make it difficult to employ electronic instrumentation.
High Temporal Resolution (Fast)
In general terms, the method of data acquisition used alongside ECVT is very fast. Data can be sampled from the sensor at several thousand times per second depending on the number of plate pairs in the sensor design and the analog design of the data acquisition system (i.e. clock speed, parallel circuitry, etc.). The potential for collecting data very quickly makes the technology very attractive to industries which have processes that occur very quickly or transport at high speeds. This is a great contrast to MRI which has high spatial resolution but often very poor temporal resolution.
Challenges for Spatial Resolution in ECVT
As noted above, spatial resolution is a fundamental challenge in ECT/ECVT. The spatial resolution is limited by the soft-field nature of ECT/ECVT and the fact that the interrogating electric field in ECT/ECVT is quasi-static in nature. The latter property implies that the potential distribution between the plates is a solution of Laplace equation. As a consequence, there cannot be any relative minima or maxima for the potential distribution between the plates and hence no focal spots can be produced.
In order to increase spatial resolution, two basic strategies can be pursued. The first strategy consists of enriching the measurement data. This can be done by (a) adaptive acquisitions with synthetic electrodes,[10] (b) multi-frequency operation to exploit permittivity variations with frequency due to the MWS effect,[14] and (c) combining ECT/ECVT with other sensing modalities, either based on the same hardware (such as DCPT) or on additional hardware (such as microwave tomography). The second strategy to increase spatial resolution consists in the development of multi-stage image reconstruction that incorporate a priori information and training data sets, and spatial adaptivity.
Applications
Multi-Phase Flow
Multi-phase flow refers to simultaneous flow of materials of different physical states or chemical compositions, and is heavily involved in petroleum, chemical and biochemical industries. In the past, ECVT has been extensively tested in a wide range of multi-phase flow systems in laboratory as well as industrial settings.[9] ECVT’s unique ability to obtain real-time non-invasive spatial visualization of systems with complex geometries under different temperature and pressure conditions at relatively low costs renders it favorable for both fundamental fluid mechanics research and applications in large-scale processing industries. Recent research efforts in exploring these two aspects are summarized below.
Gas-Solid

Gas-solid fluidized bed is a typical gas-solid flow system, and has been widely employed in chemical industries due to its superior heat and mass transfer and solid transport and handling. ECVT has been successfully applied to gas-solid fluidized bed systems for system properties measurements and dynamic behaviors visualization. An example is the study of choking phenomenon in a 0.1 m ID gas-solid circulating fluidized bed with a 12-channel cylindrical ECVT sensor,[23] where the formation of slug during transition to choking is clearly recorded by ECVT. Another experiment studies the bubbling gas-solid fluidization in a 0.05 ID column, where the solid holdup, bubble shape and frequency obtained from ECVT are validated with MRI measurements.[24] The flexibility of the ECVT sensor geometry also enables it for imaging of bend, tapering and other non-uniform sections of gas-solid flow reactors. For example, a horizontal gas jet penetrating into a cylindrical gas-solid fluidized bed can be imaged with a modified ECVT sensor, and information such as penetration length and width of the jet as well as jet coalescence behavior with the bubbles in the fluidized bed can be obtained from ECVT.[25]
Another example is ECVT imaging of the riser and bend of a gas-solid circulating fluidized bed (CFB).[22] A core-annulus flow structure in both the riser and the bend and a solid accumulation in the horizontal section of the bend are identified from quantitative ECVT images.
Gas-Liquid

Gas-liquid bubble column is a typical gas-liquid flow system that is widely used in petrochemical and biochemical processes. The bubbling flow phenomena have been extensively researched with computational fluid dynamic methods as well as traditional invasive measurement techniques. ECVT possesses the unique ability to obtain real-time quantitative visualization of an entire gas-liquid flow field. An example is the study of the dynamics of spiral bubble plumes in bubble columns.[27][26] ECVT is shown to be able to capture the spiral motion of bubble plumes, the structures of large scale liquid vortices and gas holdup distributions.
Another example of the application of ECVT in gas-liquid systems is the study of a cyclonic gas-liquid separator,[28] where a gas-liquid mixture enters a horizontal column tangentially and creates a swirling flow field where gas and liquid is separated by centrifugal force. ECVT successfully captures the liquid distribution inside the vessel and the off-centered gas core drifting phenomenon. The quantitative results match mechanistic models.
Gas-Liquid-Solid
The trickle bed reactor (TBR) is a typical three-phase gas-liquid-solid system, and has applications in petroleum, petrochemical, biochemical, electrochemical and water treatment industries. In a TBR, gas and liquid flow downward concurrently through packed solid materials. Depending on the gas and liquid flow rates, TBR can have different flow regimes, including trickling flow, pulsating flow and dispersed-bubble flow. ECVT has been successfully used to image the turbulent pulsating flow in a TBR,[29] and detailed pulse structure and pulse velocity can be obtained from ECVT.
Combustion (High Temperature and Flame)
Most of the gas-solid flow systems in chemical industries operate at elevated temperatures for optimal reaction kinetics. Under such harsh conditions, many laboratory measurement techniques are no longer available. However, ECVT has the potential for high-temperature applications due to its simple and robust design and non-invasive nature, which allows for insulating materials to be imbedded in the sensor for heat-resistance. Currently the high-temperature ECVT technology is under rapid development and research efforts are being made to address engineering issues associated with high temperatures.
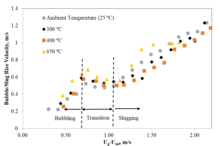
ECVT has been utilized in environments of high temperatures up to 650 °C[30] to image and characterize fluidized beds under high temperatures such as those used in fluidized bed reactors, fluid catalytic cracking and fluidized bed combustion. The application of this technology to high temperature fluidized beds has allowed the in-depth analysis of how temperature affects flow behavior in the beds. For instance, in a slugging fluidized bed with large column height to column diameter ratio with Geldart Group D particles, increasing temperature up to 650 °C can change the density and viscosity of the gas, but has negligible effect on slugging behavior such as slug velocity and frequency.
Non-Destructive Testing (NDT)
In the infrastructure inspection industry, it is desirable to use equipment that inspects embedded components non-invasively. Issues such as corroded steel, water penetration, and air voids are often embedded within concrete or other solid members. Here, non-destructive testing (NDT) methods must be used to avoid compromising the integrity of the structure. ECVT has been used in this field for the non-destructive testing of external tendons on post-tensioned bridges.[31] These structures are filled with steel cables and protective grouting or grease.
In this application, a mobilized, remotely-controlled ECVT device is placed around the external tendon and scans the interior of the tendon. The ECVT device can then decipher information about the quality of the grouting or grease within the tendon in real time. It can also determine the size and location of any air voids or moisture within the tendon. Finding these issues is a critical task for bridge inspectors, as air and moisture pockets within the tendons can lead to corrosion of steel cables and failure of the tendon, which puts the bridge at risk of structural damage.
See also
References
- 1 2 Warsito, W.; Marashdeh, Q.; Fan, L.-S. (2007). "Electrical Capacitance Volume Tomography". IEEE Sensors. 7: 525–535.
- ↑ Warsito, W.; Fan, L.-S. (2003). "Development of 3-dimensional electrical capacitance tomography based on neural network multi-criterion optimization". Proc. 3rd World Congr. Industrial Tomography: 391–396.
- ↑ W. Warsito, Q. Marashdeh, and L.S. Fan “3D and Real Time Electrical Capacitance Volume Tomography Sensor Design and Image Reconstruction”, Patent No.: US 8,614,707 B2, Priority date March 22, 2005; PCT No.: PCT/US2OO6/O1O352, PCT Pub. No.: WO2006/102388, Prior Publication Data: US 201O/OO973.74 A1 Apr. 22, 2010
- ↑ Marashdeh, Q.; Teixeira, F. (March 2004). "Sensitivity Matrix Calculation for Fast 3-D Electrical Capacitance Tomography (ECT) of Flow Systems". IEEE Transactions on Magnetics. 40.
- ↑ Marashdeh, Q.; Teixeira, F. (July 2004). "Correction to: "Sensitivity Matrix Calculation for Fast 3-D Electrical Capacitance Tomography (ECT) of Flow Systems"". IEEE Transactions on Magnetics. 40.
- ↑ Warsito, W.; Marashdeh, Q.; Fan, L.-S. (2007). "Some comments on 'Spatial imaging with 3D capacitance measurements'". Meas. Sci. Technol. 18: 3665–3667.
- ↑ Hansen, P.C. (2010). Discrete Inverse Problems: Insight and Algorithms. Ser. Fundamentals of Algorithms, N. J. Higham, Ed. Philadelphia, PA: SIAM. doi:10.1137/1.9780898718836. ISBN 978-0-89871-696-2.
- 1 2 Yang, W.Q.; Peng, L.H. (Jan 2003). "Image reconstruction algorithms for electrical capacitance tomography". Meas. Sci. Technol. 14 (1): R1–R13.
- 1 2 Wang, F.; Marashdeh, Q.M.; Fan, L.-S.; Warsito, W. (2010). "Electrical Capacitance Volume Tomography: Design and Applications". Sensors (Basel, Switzerland). 10 (3): 1890–1917. doi:10.3390/s100301890. PMC 3264458. PMID 22294905.
- 1 2 Marashdeh, Q.M.; Teixeira, F.L.; Fan, L.-S. (2014). "Adaptive Electrical Capacitance Volume Tomography". IEEE Sensors J. 14 (4): 1253,1259.
- 1 2 3 4 Chowdhury, S.; Marashdeh, Q.M.; Teixeira, F.L. (2016). "Velocity Profiling of Multiphase Flows Using Capacitive Sensor Sensitivity Gradient". IEEE Sensors Journal. 16 (23): 8365–8373.
- ↑ Marashdeh, Q.; Warsito, W.; Fan, L.-S.; Teixeira, F.L. (2006). "Nonlinear image reconstruction technique for ECT using a combined neural network approach". Meas. Sci. Technol. 17 (8): 2097–2103.
- ↑ Gunes, C.; Marashdeh, Q.; Teixeira, F.L. (2017). "A Comparison Between Electrical Capacitance Tomography and Displacement-Current Phase Tomography". IEEE Sensors J. 17 (24): 8037–8046. doi:10.1109/JSEN.2017.2707284.
- 1 2 3 4 5 Rasel, R.K.; Zuccarelli, C.E.; Marashdeh, Q.M.; Fan, L.-S.; Teixeira, F.L. (2017). "Towards multiphase flow decomposition based on electrical capacitance tomography sensors". IEEE Sensors Journal. 17 (24): 8027–8036. doi:10.1109/JSEN.2017.2687828.
- ↑ Maxwell, J.C. (1892). 'A Treatise on Electricity and Magnetism. Clarendon, Oxford.
- ↑ Wagner, K.W. (1914). "The after-effect in dielectrics". Arch. Elektrotech. 2: 371–387.
- ↑ Sillars, R.W. (1937). "The properties of a dielectric containing semiconductor particles of various shapes". J. Inst. Elec. Engrs. 80: 378–394.
- 1 2 "Maxwell-Wagner-Sillars Polarization". Wikipedia.
- ↑ Becher, P. (1983). "Dielectric Properties of Emulsions and Related Systems". Encyclopedia of Emulsion Technology. 1.
- ↑ Bruggeman, D.A. (1935). "Berechnung verschiedener physikalischer konstanten von heterogenen substanzen". Ann. Phys. 24: 636–664.
- ↑ Hanai, T. (1960). "Theory of the dielectric dispersion due to interfacial polarization and its application to emulsions". Kolloid-Zeitschrift. 171: 23–31.
- 1 2 Wang, F.; Marashdeh, Q.; Wang, A.; Fan, L.-S. (2012). "Electrical Capacitance Volume Tomography Imaging of Three-Dimensional Flow Structures and Solids Concentration Distributions in a Riser and a Bend of a Gas–Solid Circulating Fluidized Bed". Industrial & Engineering Chemistry Research. 51 (33): 10968–10976.
- ↑ Du, B.; Warsito, W.; Fan, L.-S. (2006). "Imaging the Choking Transition in Gas−Solid Risers Using Electrical Capacitance Tomography". Industrial & Engineering Chemistry Research. 45 (15): 5384–5395.
- ↑ Holland, D.J.; Marashdeh, Q.M.; Muller, C.R. (Jan 2009). "Comparison of ECVT and MR measurements of voidage in a gas-fluidized bed". Ind. Eng. Chem. Res. 48 (1): 172–181.
- ↑ Wang, F.; Marashdeh, Q.; Fan, L.-S. (2010). "Horizontal gas and gas/solid jet penetration in a gas–solid fluidized bed". Chemical Engineering Science. 65 (11): 3394–3408.
- 1 2 Warsito, W.; Fan, L.-S. (2005). "Dynamics of spiral bubble plume motion in the entrance region of bubble columns and three-phase fluidized beds using 3D ECT". Chemical Engineering Science. 60 (22): 6073–6084.
- ↑ Wang, A.; Marashdeh, Q.; Fan, L.-S. (2014). "ECVT imaging of 3D spiral bubble plume structures in gas-liquid bubble columns". The Canadian Journal of Chemical Engineering. 92 (12): 2078–2087.
- ↑ Wang, A.; Marashdeh, Q.; Fan, L.-S. (2016). "ECVT imaging and model analysis of the liquid distribution inside a horizontally installed passive cyclonic gas–liquid separator". Chemical Engineering Science. 141: 231–239.
- ↑ Wang, A.; Marashdeh, Q.; Motil, B.; Fan, L.-S. (2014). "Electrical capacitance volume tomography for imaging of pulsating flows in a trickle bed". Chemical Engineering Science. 119: 77–87.
- 1 2 Wang, D.; Xu, M.; Marashdeh, Q.; Straiton, B.; Tong, A.; Fan, L.-S. (2018). "Electrical Capacitance Volume Tomography for Characterization of Gas-Solid Slugging Fluidization with Geldart Group D Particles under High Temperatures". Ind. Eng. Chem. Res. 57 (7): 2687–2697. doi:10.1021/acs.iecr.7b04733.
- ↑ "Bridge Inspection". R&D 100 Conference. 2015.