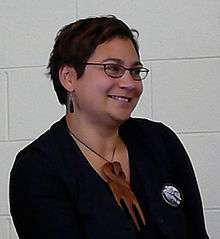
Electoral history of Metiria Turei

This is a summary of the electoral history of Metiria Turei, Female co-leader of the Green Party of Aotearoa New Zealand (2009–2017) and Member of Parliament for list (2002–present).

Parliamentary elections
1993 election
| Party | Candidate | Votes | % | ± | |
|---|---|---|---|---|---|
| Labour | Jonathan Hunt | 6,974 | 38.8 | -3.1 | |
| Alliance | Cliff Robinson | 5,376 | 29.9 | ||
| National | Roger Seavill | 3,642 | 20.2 | ||
| NZ First | Dawn Mullins | 1,474 | 8.2 | ||
| Christian Heritage | Charles Hinds | 360 | 2.0 | ||
| McGillicuddy Serious | Metiria Turei | 121 | 0.6 | ||
| Majority | 1,598 | 8.9 | +2.8 | ||
| Turnout | 17,947 | ||||
2002 election
| General election, 2002: Tamaki Makaurau[2] | |||||||||
|---|---|---|---|---|---|---|---|---|---|
| Notes: |
Blue background denotes the winner of the electorate vote.
| ||||||||
| Party | Candidate | Votes | % | ±% | Party votes | % | ±% | ||
| Labour | John Tamihere | 11,445 | 73.35 | 9,052 | 55.97 | ||||
| Green | Metiria Turei | 2,001 | 12.82 | 1,659 | 10.26 | ||||
| National | George Rongokino Ngatai | 785 | 5.03 | 516 | 3.19 | ||||
| Alliance | Janice Smith | 550 | 3.52 | 470 | 2.91 | ||||
| Christian Heritage | Tuhimareikura Vaha'akolo | 472 | 3.02 | 240 | 1.48 | ||||
| Progressive | Sue Wharewhaka-Topia Watts | 351 | 2.25 | 228 | 1.41 | ||||
| NZ First | 2,430 | 15.03 | |||||||
| Mana Māori | 464 | 2.87 | |||||||
| Legalise Cannabis | 423 | 2.62 | |||||||
| United Future | 411 | 2.54 | |||||||
| ACT | 223 | 1.38 | |||||||
| ORNZ | 51 | 0.32 | |||||||
| One NZ | 4 | 0.02 | |||||||
| NMP | 2 | 0.01 | |||||||
| Informal votes | 380 | 122 | |||||||
| Total Valid votes | 15,604 | 16,173 | |||||||
| Turnout | 16,688 | 54.22 | |||||||
| Labour win new seat | Majority | 9,444 | 60.52 | ||||||
2005 election
| General Election 2005: Te Tai Tonga[3] | |||||||||
|---|---|---|---|---|---|---|---|---|---|
| Notes: |
Blue background denotes the winner of the electorate vote.
| ||||||||
| Party | Candidate | Votes | % | ±% | Party votes | % | ±% | ||
| Labour | 9,015 | 47.23 | -15.94 | 11,485 | 57.89 | ||||
| Māori | Monte Ohia | 6,512 | 34.12 | +34.12 | 3,481 | 17.55 | |||
| Green | Metiria Turei | 2,296 | 12.03 | 1,283 | 6.47 | ||||
| Progressive | Russell Caldwell | 705 | 3.69 | 169 | 0.85 | ||||
| Destiny | Maru Samuel | 559 | 2.93 | 235 | 1.18 | ||||
| National | 1,462 | 7.37 | |||||||
| NZ First | 1,240 | 6.25 | |||||||
| United Future | 211 | 1.06 | |||||||
| Legalise Cannabis | 159 | 0.80 | |||||||
| ACT | 58 | 0.29 | |||||||
| Alliance | 14 | 0.07 | |||||||
| Christian Heritage | 9 | 0.05 | |||||||
| Democrats | 8 | 0.04 | |||||||
| Family Rights | 7 | 0.04 | |||||||
| Libertarianz | 4 | 0.02 | |||||||
| One NZ | 4 | 0.02 | |||||||
| 99 MP | 3 | 0.02 | |||||||
| Direct Democracy | 3 | 0.02 | |||||||
| RONZ | 3 | 0.02 | |||||||
| Informal votes | 655 | 322 | |||||||
| Total Valid votes | 19,087 | 19,838 | |||||||
| Labour hold | Majority | 2,503 | 13.11 | -38.99 | |||||
2008 election
| General Election 2008: Dunedin North[4] | |||||||||
|---|---|---|---|---|---|---|---|---|---|
| Notes: |
Blue background denotes the winner of the electorate vote.
| ||||||||
| Party | Candidate | Votes | % | ±% | Party votes | % | ±% | ||
| Labour | 17,127 | 52.62 | −2.46 | 14,608 | 44.24 | −10.58 | |||
| National | Michael Woodhouse | 9,972 | 30.64 | −0.79 | 9,692 | 29.35 | +4.21 | ||
| Green | Metiria Turei | 3,611 | 11.09 | +3.64 | 5,221 | 15.81 | +4.99 | ||
| ACT | Hilary Calvert | 573 | 1.76 | +1.15 | 749 | 2.27 | +1.28 | ||
| Legalise Cannabis | Julian Crawford | 483 | 1.48 | −0.06 | 143 | 0.43 | +0.14 | ||
| Alliance | Victor Billot | 448 | 1.38 | +0.54 | 106 | 0.32 | +0.12 | ||
| United Future | Mary Edwards | 228 | 0.70 | −1.32 | 312 | 0.94 | −1.82 | ||
| Democrats | Olive McRae | 105 | 0.32 | +0.32 | 36 | 0.11 | +0.05 | ||
| NZ First | 1,132 | 3.43 | +0.58 | ||||||
| Progressive | 310 | 0.94 | −1.38 | ||||||
| Bill and Ben | 252 | 0.76 | +0.76 | ||||||
| Māori | 230 | 0.70 | +0.41 | ||||||
| Kiwi | 125 | 0.38 | +0.38 | ||||||
| Family Party | 57 | 0.17 | +0.17 | ||||||
| Workers Party | 18 | 0.05 | +0.05 | ||||||
| Pacific | 14 | 0.04 | +0.04 | ||||||
| Libertarianz | 9 | 0.03 | −0.01 | ||||||
| RAM | 4 | 0.01 | +0.01 | ||||||
| RONZ | 2 | 0.01 | −0.01 | ||||||
| Informal votes | 234 | 89 | |||||||
| Total Valid votes | 32,547 | 33,020 | |||||||
| Labour hold | Majority | 7,155 | 21.98 | −1.67 | |||||
2011 election
| General Election 2011: Dunedin North[5] | |||||||||
|---|---|---|---|---|---|---|---|---|---|
| Notes: |
Blue background denotes the winner of the electorate vote.
| ||||||||
| Party | Candidate | Votes | % | ±% | Party votes | % | ±% | ||
| Labour | David Clark | 12,976 | 44.25 | −8.37 | 10,127 | 33.80 | −10.44 | ||
| National | Michael Woodhouse | 9,487 | 32.35 | +1.71 | 9,707 | 32.39 | +3.04 | ||
| Green | Metiria Turei | 5,721 | 19.51 | +8.42 | 7,010 | 23.39 | +7.58 | ||
| Legalise Cannabis | Julian Crawford | 398 | 1.36 | −0.13 | 172 | 0.57 | +0.14 | ||
| Alliance | Victor Billot | 210 | 0.72 | −0.66 | 50 | 0.17 | −0.15 | ||
| Democrats | Jeremy Noble | 196 | 0.67 | +0.35 | 62 | 0.21 | +0.10 | ||
| United Future | Peter George | 176 | 0.60 | −0.10 | 183 | 0.61 | −0.33 | ||
| ACT | Guy McCallum | 159 | 0.54 | −1.22 | 218 | 0.73 | −1.54 | ||
| NZ First | 1,706 | 5.69 | +2.27 | ||||||
| Conservative | 405 | 1.35 | +1.35 | ||||||
| Mana | 181 | 0.60 | +0.60 | ||||||
| Māori | 126 | 0.42 | −0.28 | ||||||
| Libertarianz | 18 | 0.06 | +0.03 | ||||||
| Informal votes | 448 | 190 | |||||||
| Total Valid votes | 29,323 | 29,965 | |||||||
| Labour hold | Majority | 3,489 | 11.90 | −10.09 | |||||
Electorate (as at 26 November 2011): 40,356[6]
2014 election
| General Election 2014: Dunedin North[7] | |||||||||
|---|---|---|---|---|---|---|---|---|---|
| Notes: |
Blue background denotes the winner of the electorate vote.
| ||||||||
| Party | Candidate | Votes | % | ±% | Party votes | % | ±% | ||
| Labour | 16,315 | 47.40 | +3.15 | 11,147 | 31.82 | −1.98 | |||
| National | Michael Woodhouse | 10,398 | 30.21 | −2.14 | 11,302 | 32.26 | −0.13 | ||
| Green | Metiria Turei | 5,978 | 17.37 | −2.14 | 8,035 | 22.94 | −0.45 | ||
| Conservative | Jonathan Daley | 621 | 1.80 | +1.80 | 956 | 2.73 | +1.38 | ||
| Legalise Cannabis | Abe Gray | 580 | 1.69 | +0.33 | 172 | 0.49 | −0.08 | ||
| Internet | Rob Stewart | 255 | 0.74 | +0.74 | |||||
| Independent | Adrian Daegal Graamans | 106 | 0.31 | +0.31 | |||||
| Democrats | Miriam Mowat | 159 | 0.31 | −0.36 | 37 | 0.11 | −0.10 | ||
| Independent | Stan Lusby | 62 | 0.18 | +0.18 | |||||
| NZ First | 2,364 | 6.75 | +1.06 | ||||||
| Internet Mana | 603 | 1.72 | +1.12[lower-alpha 1] | ||||||
| Māori | 124 | 0.35 | −0.07 | ||||||
| ACT | 111 | 0.32 | −0.41 | ||||||
| United Future | 86 | 0.25 | −0.29 | ||||||
| Ban 1080 | 60 | 0.17 | +0.17 | ||||||
| Civilian | 27 | 0.08 | +0.08 | ||||||
| Independent Coalition | 7 | 0.02 | +0.02 | ||||||
| Focus | 1 | 0.00 | +0.00 | ||||||
| Informal votes | 216 | 99 | |||||||
| Total Valid votes | 34,636 | 35,131 | |||||||
| Turnout | 35,230 | 79.88 | +11.50 | ||||||
| Labour hold | Majority | 5,917 | 17.19 | +5.29 | |||||
Local elections
2001 Auckland mayoral election
| Party | Candidate | Votes | % | ± | |
|---|---|---|---|---|---|
| Independent | John Banks | 47,059 | 43.60 | ||
| Independent | Christine Fletcher | 31,699 | 29.37 | -10.92 | |
| Alliance | Matt McCarten | 15,785 | 14.62 | ||
| Independent | Tony Gibson | 5,714 | 5.29 | ||
| Green | Metiria Turei | 2,213 | 2.05 | ||
| Independent | Sue Henry | 1,761 | 1.63 | +0.86 | |
| Christians Against Abortion | Phil O'Connor | 1,258 | 1.16 | +0.24 | |
| One NZ | Walter Christie | 1,189 | 1.10 | ||
| Communist League | Felicity Coggan | 610 | 0.56 | +0.30 | |
| Independent | Fran Van Helmond | 437 | 0.40 | ||
| Informal votes | 203 | 0.18 | |||
| Majority | 15,397 | 14.26 | |||
| Turnout | 107,928 | ||||
Notes
- ↑ 2014 Internet Mana swing is relative to the votes for Mana in 2011; it shared a party list with Internet in the 2014 election.
References
- ↑ Part 1: Votes recorded at each polling place (Technical report). New Zealand Chief Electoral Office. 1993.
- ↑ "Tāmaki Makaurau - Electorate Profile" (PDF). New Zealand Parliamentary Library. September 2012. Retrieved 13 January 2017.
- ↑ 2005 Election Results
- ↑ 2008 Election Results
- ↑ 2011 Election Results
- ↑ "Enrolment statistics". Electoral Commission. 26 November 2011. Retrieved 13 December 2011.
- ↑ 2014 Election Results
- ↑ "Banks beats Fletcher for hearts of Aucklanders". The New Zealand Herald. 14 October 2001. Retrieved 25 May 2017.
- ↑ "Final Official Election Results". Archived from the original on 27 June 2002. Retrieved 11 July 2017.