Electoral district of Wagga Wagga
| Wagga Wagga New South Wales—Legislative Assembly | |||||||||||||||
|---|---|---|---|---|---|---|---|---|---|---|---|---|---|---|---|
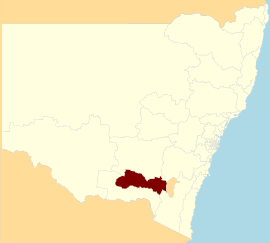 Location in New South Wales | |||||||||||||||
| State | New South Wales | ||||||||||||||
| Dates current |
1894–1904 1913–1920 1927–present | ||||||||||||||
| MP | Joe McGirr | ||||||||||||||
| Party | Independent | ||||||||||||||
| Electors | 54,881 (2017) | ||||||||||||||
| Area | 12,108.11 km2 (4,675.0 sq mi) | ||||||||||||||
| |||||||||||||||
Wagga Wagga is an electoral district of the Legislative Assembly in the Australian state of New South Wales. The district has been held by independent MP Joe McGirr since the September 2018 by-election.
Wagga Wagga is a regional electorate. It entirely covers two local government areas: the City of Wagga Wagga and Lockhart Shire. It also covers part of the Snowy Valleys Council, which was established following the merger of Tumut Shire and Tumbarumba Shire.[1]
History
Wagga Wagga was created in 1894. In 1920, Wagga Wagga, Albury and Corowa was absorbed into Murray and elected three members under proportional representation. When proportional representation was replaced by single-member electorates in 1927, Wagga Wagga was recreated, with Matthew Kilpatrick, the Country Party candidate, winning the October election. According to the Wagga Daily Advertiser, it was a decisive vote against the continuance of the Labor government led by Jack Lang.[2]
Members for Wagga Wagga
| First incarnation (1894–1904) | |||
|---|---|---|---|
| Member | Party | Term | |
| James Gormly | Protectionist | 1894–1901 | |
| Progressive | 1901–1904 | ||
| Second incarnation (1913–1920) | |||
| Member | Party | Term | |
| Walter Boston | Labor | 1913–1917 | |
| George Beeby | Nationalist | 1917–1920 | |
| Third incarnation (1927–present) | |||
| Member | Party | Term | |
| Matthew Kilpatrick | Country | 1927–1941 | |
| Eddie Graham | Labor | 1941–1957 | |
| Wal Fife | Liberal | 1957–1975 | |
| Joe Schipp | Liberal | 1975–1999 | |
| Daryl Maguire | Liberal | 1999–2018 | |
| Independent | 2018 | ||
| Joe McGirr | Independent | 2018–present | |
Election results
| Party | Candidate | Votes | % | ± | |
|---|---|---|---|---|---|
| Liberal | Julia Ham | 12,031 | 25.5 | −28.3 | |
| Independent | Joe McGirr | 12,003 | 25.4 | +25.4 | |
| Labor | Dan Hayes | 11,197 | 23.7 | −4.4 | |
| Independent | Paul Funnell | 5,028 | 10.6 | +0.9 | |
| Shooters, Fishers and Farmers | Seb McDonagh | 4,682 | 9.9 | +9.9 | |
| Greens | Ray Goodlass | 1,377 | 2.9 | −2.1 | |
| Christian Democrats | Tom Arentz | 900 | 1.9 | −0.4 | |
| Total formal votes | 47,218 | 96.8 | +0.0 | ||
| Informal votes | 1,561 | 3.2 | −0.0 | ||
| Turnout | 48,779 | 88.3 | −1.9 | ||
| Two-candidate-preferred result | |||||
| Independent | Joe McGirr | 23,001 | 59.6 | +59.6 | |
| Liberal | Julia Ham | 15,570 | 40.4 | −22.5 | |
| Independent gain from Liberal | Swing | N/A | |||
| Party | Candidate | Votes | % | ± | |
|---|---|---|---|---|---|
| Liberal | Daryl Maguire | 25,061 | 53.8 | +0.2 | |
| Labor | Dan Hayes | 13,084 | 28.1 | +18.0 | |
| Independent | Paul Funnell | 4,523 | 9.7 | +9.7 | |
| Greens | Kevin Poynter | 2,320 | 5.0 | +1.6 | |
| Christian Democrats | Keith Pech | 1,111 | 2.4 | +0.0 | |
| No Land Tax | Joe Sidoti | 515 | 1.1 | +1.1 | |
| Total formal votes | 46,614 | 96.8 | −0.6 | ||
| Informal votes | 1,548 | 3.2 | +0.6 | ||
| Turnout | 48,162 | 90.3 | +0.4 | ||
| Two-party-preferred result | |||||
| Liberal | Daryl Maguire | 26,704 | 62.9 | −14.9 | |
| Labor | Dan Hayes | 15,756 | 37.1 | +14.9 | |
| Liberal hold | Swing | −14.9 | |||
References
- ↑ "Wagga Wagga". New South Wales Electoral Commission. Retrieved 2015-02-28.
- ↑ "Kilpatrick Wins Easily". Daily Advertiser (Wagga Wagga, NSW). 10 October 1927. Retrieved 6 February 2015.
- ↑ First Preference Votes Report Parliamentary Election: Wagga Wagga, NSWEC.
- ↑ Distribution of Preferences Report Parliamentary Election: Wagga Wagga, NSWEC.
- ↑ State Electoral District of Wagga Wagga: First Preference Votes, NSWEC.
- ↑ State Electoral District of Wagga Wagga: Distribution of Preferences, NSWEC.
External links
- "Wagga Wagga". New South Wales Electoral Commission. Retrieved 2011-09-24.