Eastern Interconnection
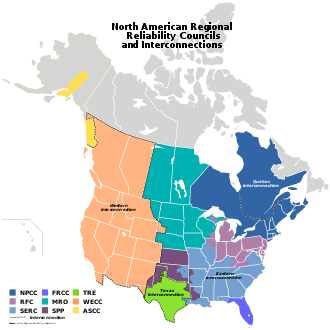
The Eastern Interconnection is one of the two major alternating-current (AC) electrical grids in the continental U.S. power transmission grid. The other major interconnection is the Western Interconnection. The three minor interconnections are the Quebec, Alaska, and Texas interconnections.
All of the electric utilities in the Eastern Interconnection are electrically tied together during normal system conditions and operate at a synchronized frequency at an average of 60 Hz. The Eastern Interconnection reaches from Central Canada eastward to the Atlantic coast (excluding Quebec), south to Florida, and back west to the foot of the Rockies (excluding most of Texas).
Interconnections can be tied to each other via high-voltage direct current power transmission lines (DC ties), or with variable-frequency transformers (VFTs), which permit a controlled flow of energy while also functionally isolating the independent AC frequencies of each side. The Eastern Interconnection is tied to the Western Interconnection with six DC ties, to the Texas Interconnection with two DC ties, and to the Quebec Interconnection with four DC ties and a VFT.
On October 17, 2009, the Tres Amigas SuperStation was announced to connect the Eastern, Western and Texas Interconnections via three 5 GW superconductor links.[1] As of 2017, the project was reduced in scope and only related infrastructure was constructed for nearby wind projects connecting to the Western Interconnection.
In 2016, National Renewable Energy Laboratory simulated a year with 30% renewable energy (wind and solar power) in 5-minute intervals. Results show a stable grid with some changes in operation.[2][3]
Electricity demand
The North American Electric Reliability Corporation (NERC) reported in 2008 the following actual and projected consumption for the regions of the Eastern Interconnection (all figures in gigawatts):[4]
| in GW | Summer | Winter | ||||
|---|---|---|---|---|---|---|
| Region | 2007 | 2017 | Growth | 2007 | 2017 | Growth |
| FRCC | 47 | 57 | 21.3% | 42 | 60 | 42.9% |
| MRO (US) | 42 | 52 | 23.8% | 35 | 42 | 20.0% |
| NPCC (US) | 61 | 69 | 13.1% | 48 | 53 | 10.4% |
| RFC | 180 | 209 | 16.1% | 141 | 164 | 16.3% |
| SERC | 209 | 243 | 16.3% | 179 | 209 | 16.8% |
| SPP | 43 | 51 | 18.6% | 31 | 38 | 22.6% |
| US- East Interconnection | 582 | 681 | 17.0% | 476 | 566 | 18.9% |
| MRO (CAN) | 6.2 | 6.9 | 11.3% | 7.3 | 8.2 | 12.3% |
| NPCC (CAN) | 50.3 | 50.7 | 0.8% | 65.0 | 66.7 | 2.6% |
| CAN- East Interconnection | 56.5 | 57.6 | 2.0% | 72.3 | 74.9 | 3.6% |
| Eastern Interconnection | 638.5 | 738.6 | 15.7% | 548.3 | 640.9 | 16.9% |
See also
References
- ↑ High-Temp Superconductors To Connect Power Grids
- ↑ "Eastern Renewable Generation Integration Study". National Renewable Energy Laboratory. Retrieved 8 September 2016.
- ↑ Bloom et al. Eastern Renewable Generation Integration Study page xvii. National Renewable Energy Laboratory, August 2016. Technical Report NREL/TP-6A20-64472-ES. Quote: "integrating up to 30% variable wind and PV generation into the power system is technically feasible at a five-minute interval"
- ↑ Load Forecasting Working Group of the Reliability Assessment Subcommittee (August 2008). "2008-2017 Regional and National Peak Demand and Energy Forecasts Bandwidths" (pdf). North American Electric Reliability Corporation: 7–12. Retrieved 2008-12-15.
Further reading
- 2008 Long Term Reliability Assessment 2008-2017 (PDF). North American Electric Reliability Corporation. 27 January 2009. Retrieved 2 March 2016.
- 2015 State of Reliability (PDF). North American Electric Reliability Corporation. May 2015. Retrieved 2 March 2016.
- Current projects